Fig. 3.
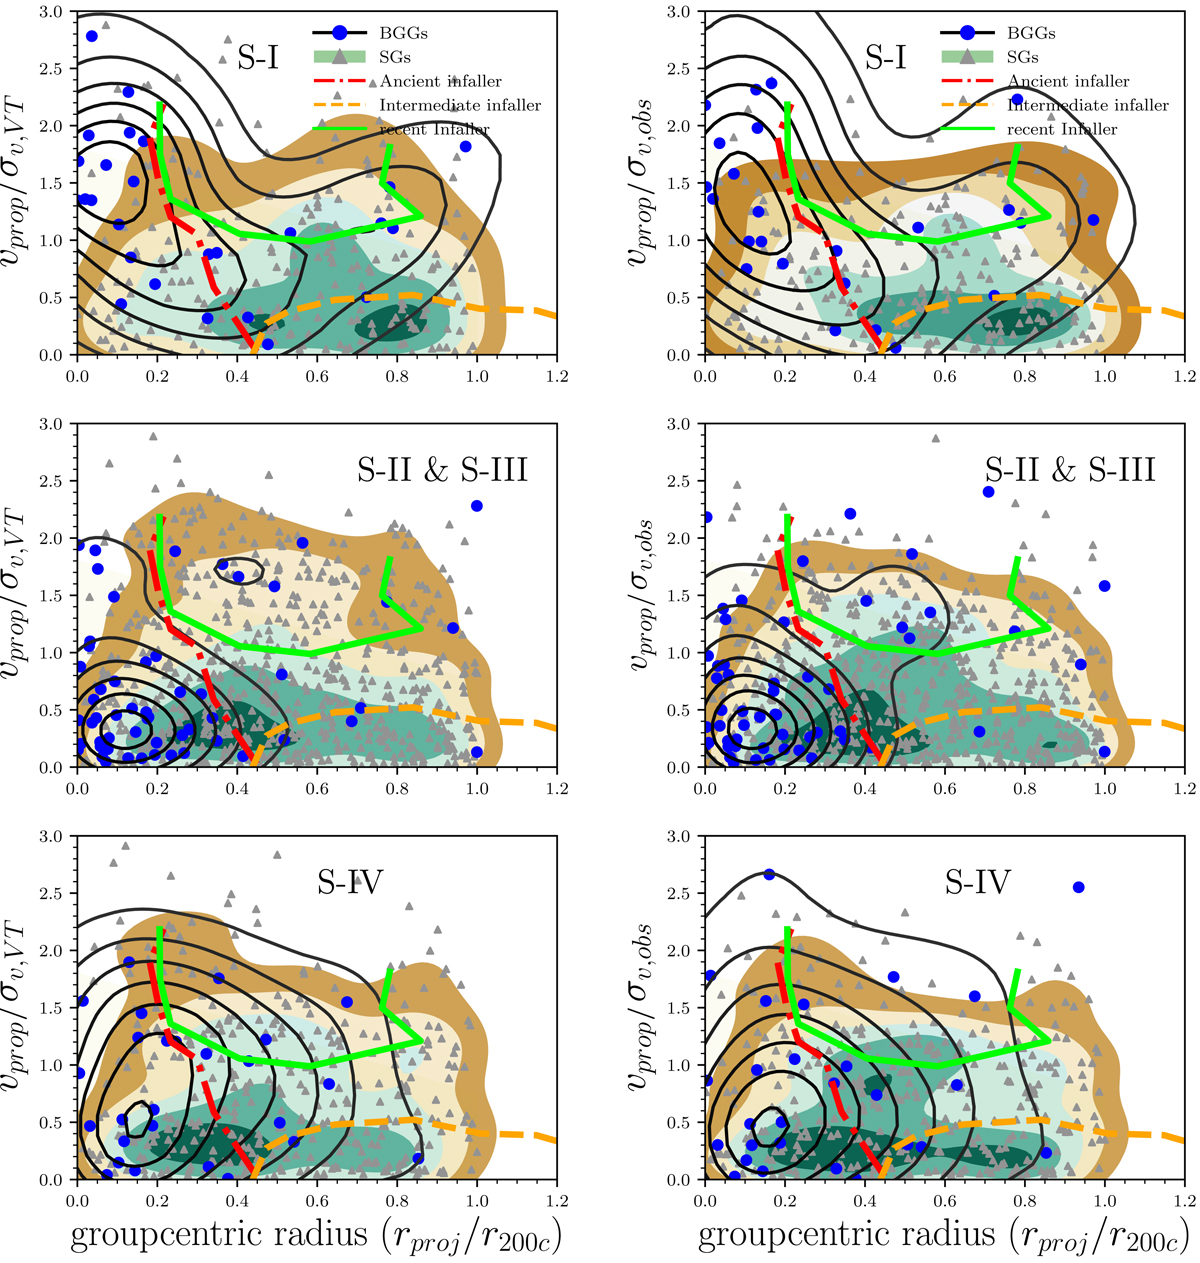
Phase-space diagrams showing the relative line-of-sight velocity of group galaxies as a function of distance from the group X-ray centre for S-I, S-II & S-III, and S-IV. The orbital velocities of galaxies are normalised either to the velocity dispersion derived using the virial theorem (left panels) or to the observed velocity dispersion (right panels). The blue and grey data points show the BGGs and all satellite galaxies (SGs) respectively. Solid black lines and shaded area represent the density contours of respectively the BGG and SGs distributions in this plane, estimated using the KDE method. The dash-dotted red, dashed orange, and solid lime isocontours are taken from Fig. 8 in Rhee et al. (2017) and represent the regions where galaxies in these areas are “ancient infallers”, “intermediate infallers”, and “recent infallers” with probabilities of 40%, 25%, and 40%. The majority of the BGGs are found in the ancient infallers area. It should be noted however that we probe a lower mass range than described in Rhee et al. (2017).
Current usage metrics show cumulative count of Article Views (full-text article views including HTML views, PDF and ePub downloads, according to the available data) and Abstracts Views on Vision4Press platform.
Data correspond to usage on the plateform after 2015. The current usage metrics is available 48-96 hours after online publication and is updated daily on week days.
Initial download of the metrics may take a while.