Fig. 2.
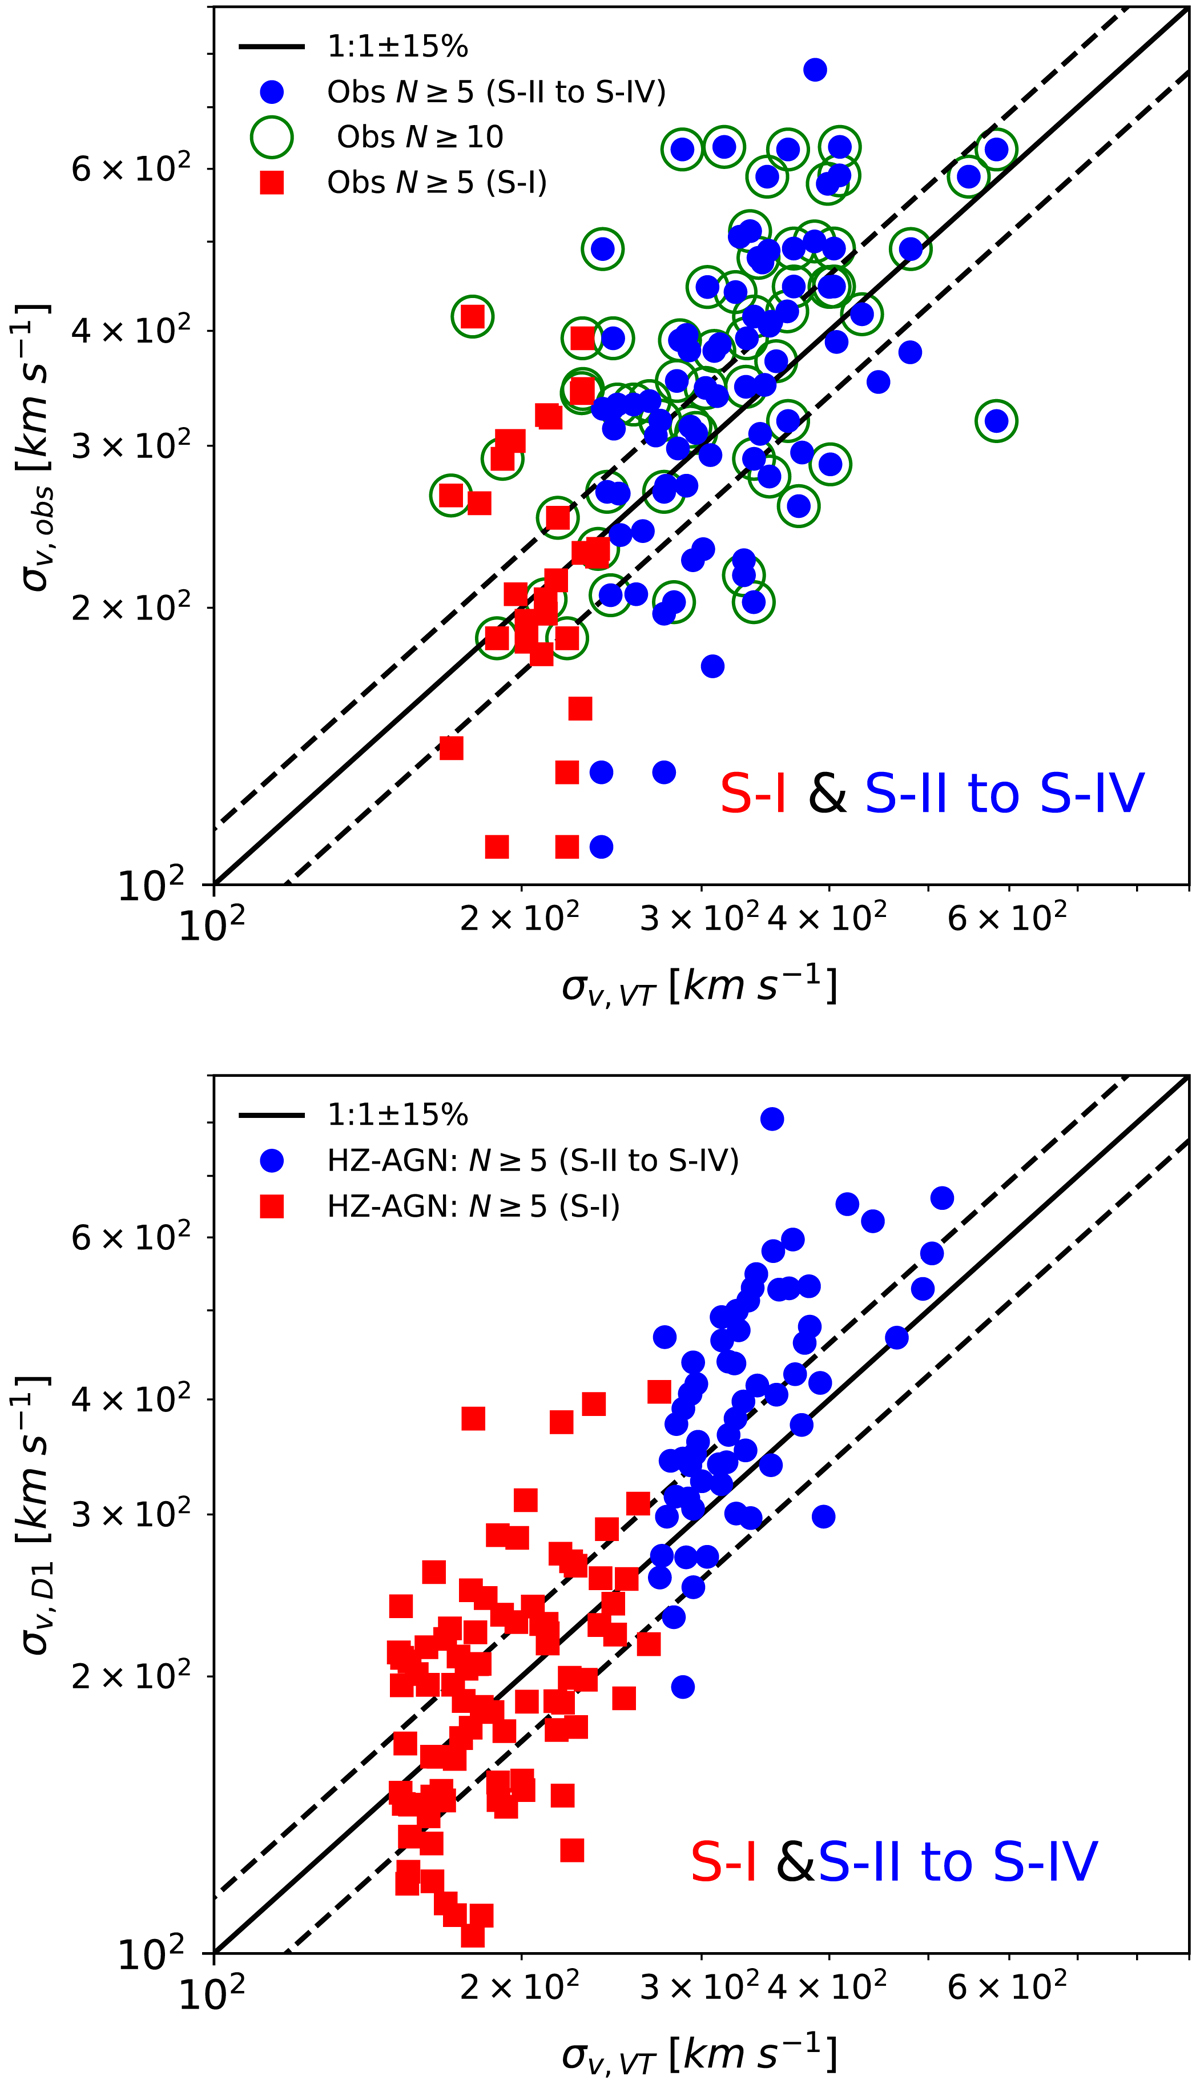
Observed velocity dispersion (σv, obs) of groups determined using their spec-z members within r200c versus the velocity dispersion predicted by the virial theorem (Eq. (3), σv, VT), in COSMOS based on Lx- halo mass scaling relation in observations (upper panel) and using the virial mass in the HORIZON-AGN simulation (lower panel). Groups with N ≥ 5 are plotted with filled blue circles and red squares. Groups with N ≥ 10 spectroscopic members are shown with open green circles. The solid and dashed black lines show the 1:1 relation and ±15% intervals. The filled red squares and blue circles represent groups in S-I and S-II to S-IV respectively.
Current usage metrics show cumulative count of Article Views (full-text article views including HTML views, PDF and ePub downloads, according to the available data) and Abstracts Views on Vision4Press platform.
Data correspond to usage on the plateform after 2015. The current usage metrics is available 48-96 hours after online publication and is updated daily on week days.
Initial download of the metrics may take a while.