Free Access
Fig. B.2
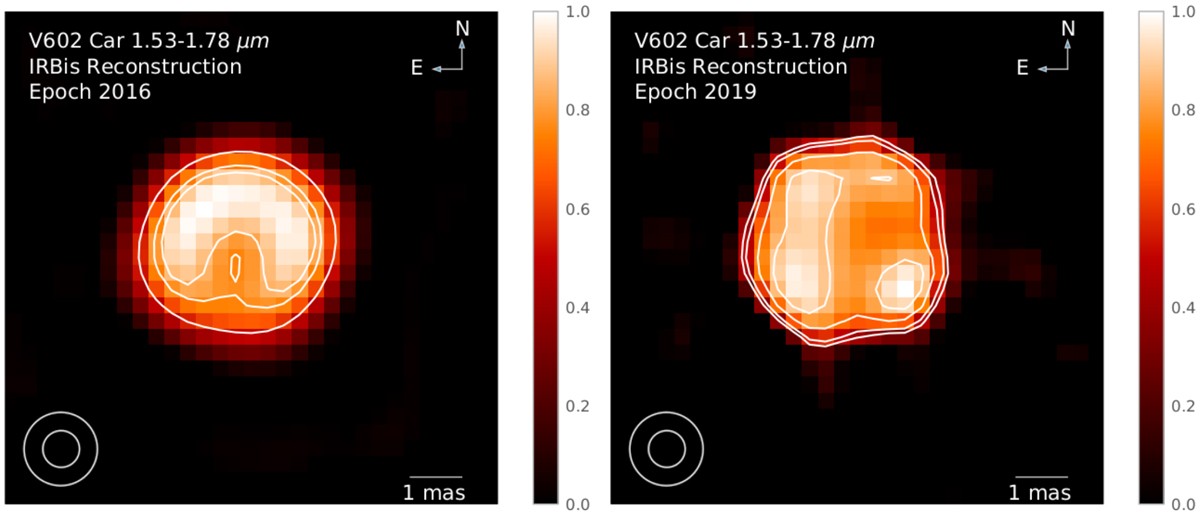
Same as Fig. 3, but for the IRBis reconstruction package. Contours are drawn at levels 55, 77, and 85% of the peak intensity in 2016 and at 40, 50, 70, and 87% of peak intensity in 2019.
Current usage metrics show cumulative count of Article Views (full-text article views including HTML views, PDF and ePub downloads, according to the available data) and Abstracts Views on Vision4Press platform.
Data correspond to usage on the plateform after 2015. The current usage metrics is available 48-96 hours after online publication and is updated daily on week days.
Initial download of the metrics may take a while.