Free Access
Fig. B.1
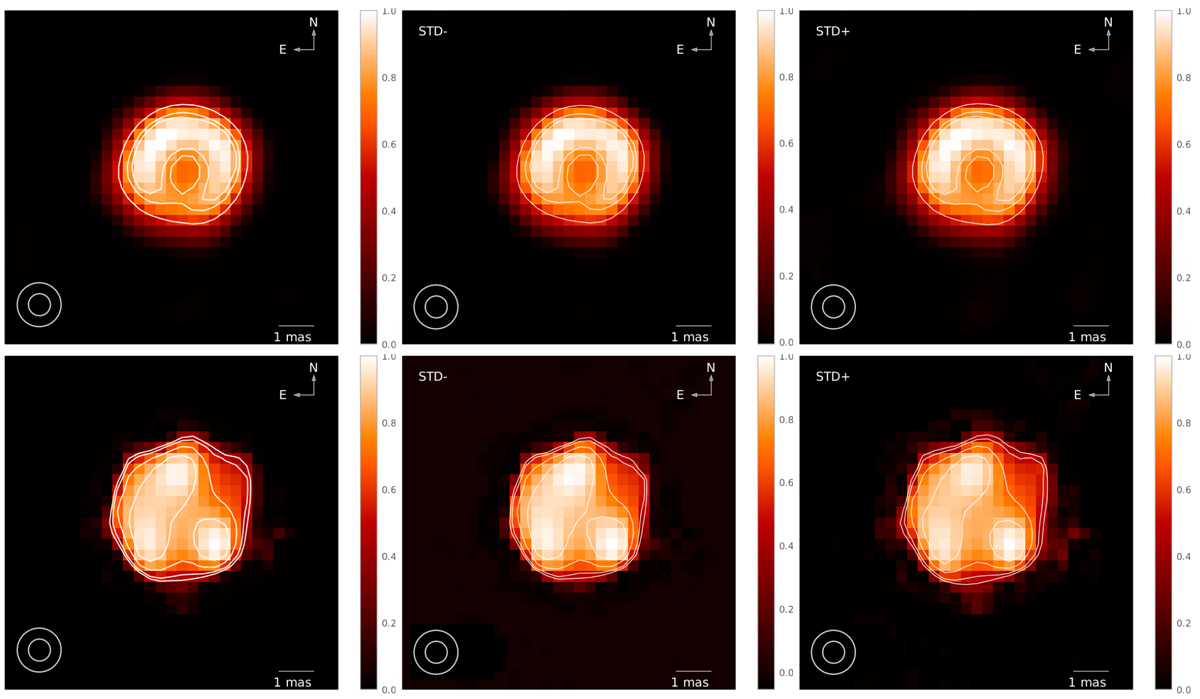
Squeeze average images (left column), images one standard deviation below the average (middle column), and images one standard deviation above the average (right column). Top row: 2016 data (contours at 55, 77, and 85% of peak intensity), bottom row: 2019 data (contours at 40, 50, 70, and 87% of peak intensity).
Current usage metrics show cumulative count of Article Views (full-text article views including HTML views, PDF and ePub downloads, according to the available data) and Abstracts Views on Vision4Press platform.
Data correspond to usage on the plateform after 2015. The current usage metrics is available 48-96 hours after online publication and is updated daily on week days.
Initial download of the metrics may take a while.