Fig. 7
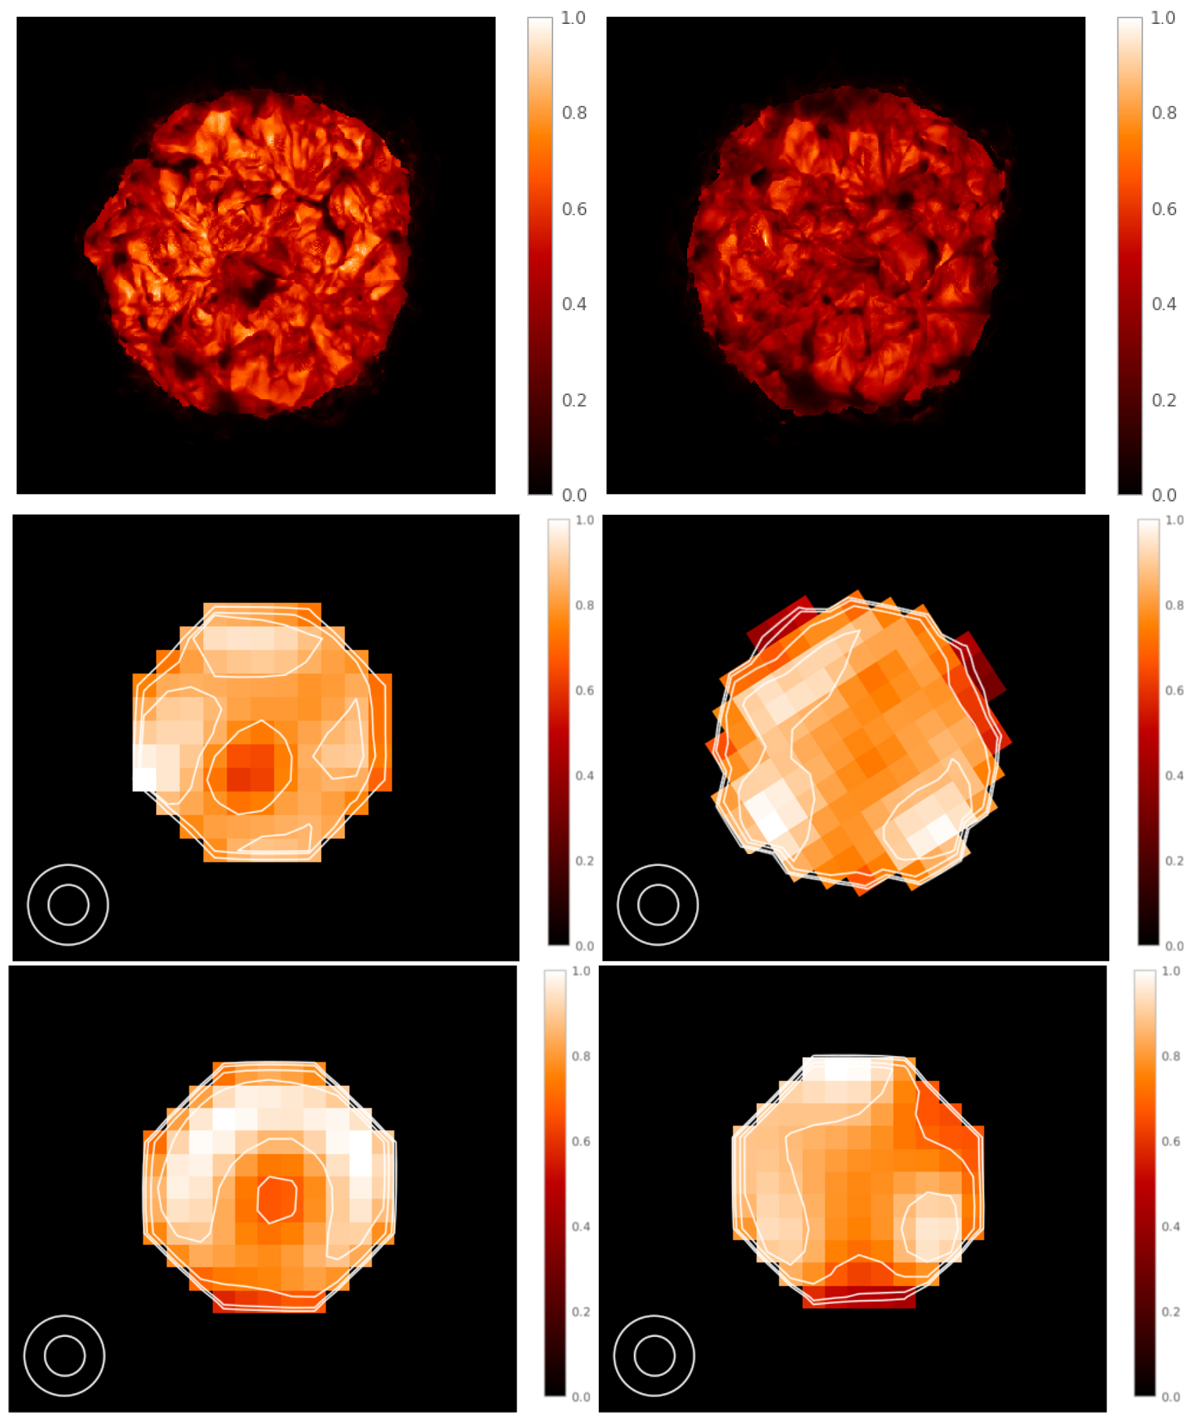
Comparison in terms of morphology between model snapshots and reconstructed images. Top row: intensity image of one of theselected best snapshots (number 065) for 2016 in relative intensity (left), and for snapshot 067, which is the best choice for the 2019 data (right). Middle row: same snapshot images as in the upper row after being convolved with a 0.6 mas beam, rotated to match the observed morphology, and corrected for the limb-darkening effect with a cut-off radius of 0.75 stellar radii. Bottom row: reconstructed observational images after LD correction and with a cut-off radius of 0.75 stellar radii. In the middle and lower rows, the contours are drawn at levels of 55, 77 and 85% of the peak intensity for 2016 (left column) and at 40, 50, 70, and 87% of the peak intensity for 2019 (right column).
Current usage metrics show cumulative count of Article Views (full-text article views including HTML views, PDF and ePub downloads, according to the available data) and Abstracts Views on Vision4Press platform.
Data correspond to usage on the plateform after 2015. The current usage metrics is available 48-96 hours after online publication and is updated daily on week days.
Initial download of the metrics may take a while.