Fig. 4
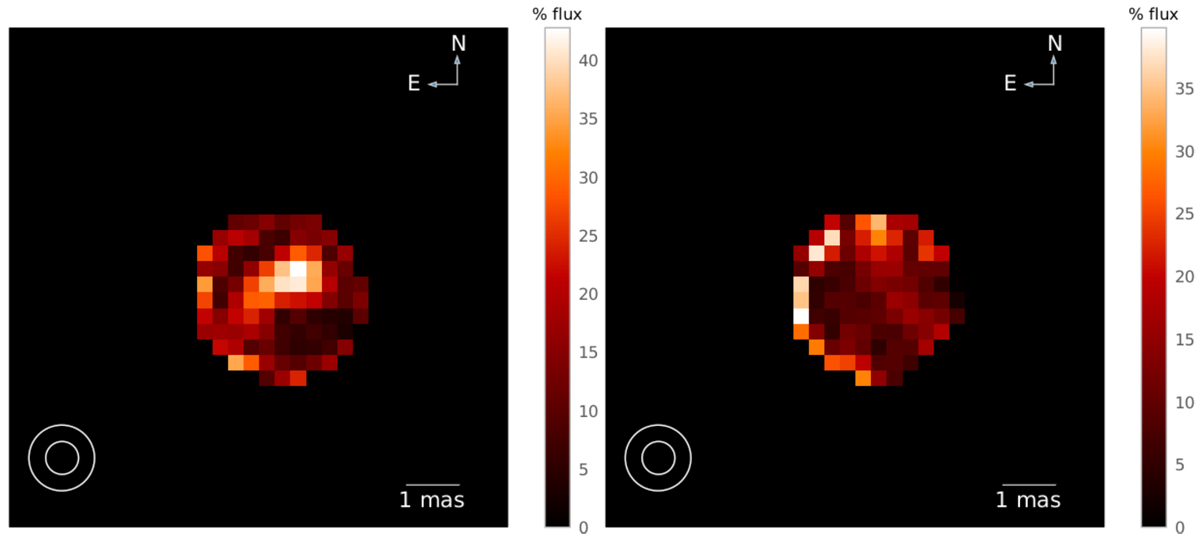
Error images for the 2016 epoch (left) and 2019 epoch (right) resulting conservatively from the addition of three possible sources of errors discussed in Appendix B. The errors are expressed in terms of the original image flux. Here and hereafter, the 3D-RHD-model-related images have been convolved with a 0.6 mas beam, that is, our best estimate of the real resolution obtained (see Appendix B.3).
Current usage metrics show cumulative count of Article Views (full-text article views including HTML views, PDF and ePub downloads, according to the available data) and Abstracts Views on Vision4Press platform.
Data correspond to usage on the plateform after 2015. The current usage metrics is available 48-96 hours after online publication and is updated daily on week days.
Initial download of the metrics may take a while.