Fig. 3
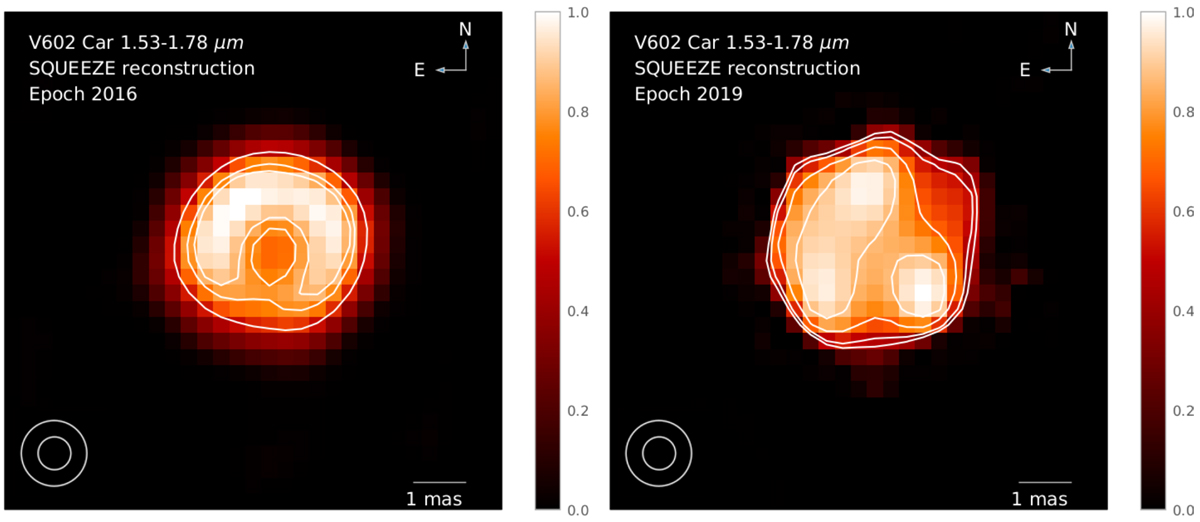
SQUEEZE reconstruction of V602 Car with spectral channels combined. Left: 2016 data set. Contours are drawnat levels 55, 77 and 85% of the peak intensity. Right: 2019 data set. In this case, contours are drawn at levels 40, 50, 70, and 87% of the peak intensity. Here and hereafter, the pixel scale is 0.3 mas pixel−1. The size of the circles in the lower left corners indicate our nominal angular resolution of 1.2 mas and the smallest circle represents our best estimate of the real resolution obtained, 0.6 mas (see Appendix B.3).
Current usage metrics show cumulative count of Article Views (full-text article views including HTML views, PDF and ePub downloads, according to the available data) and Abstracts Views on Vision4Press platform.
Data correspond to usage on the plateform after 2015. The current usage metrics is available 48-96 hours after online publication and is updated daily on week days.
Initial download of the metrics may take a while.