Fig. 2
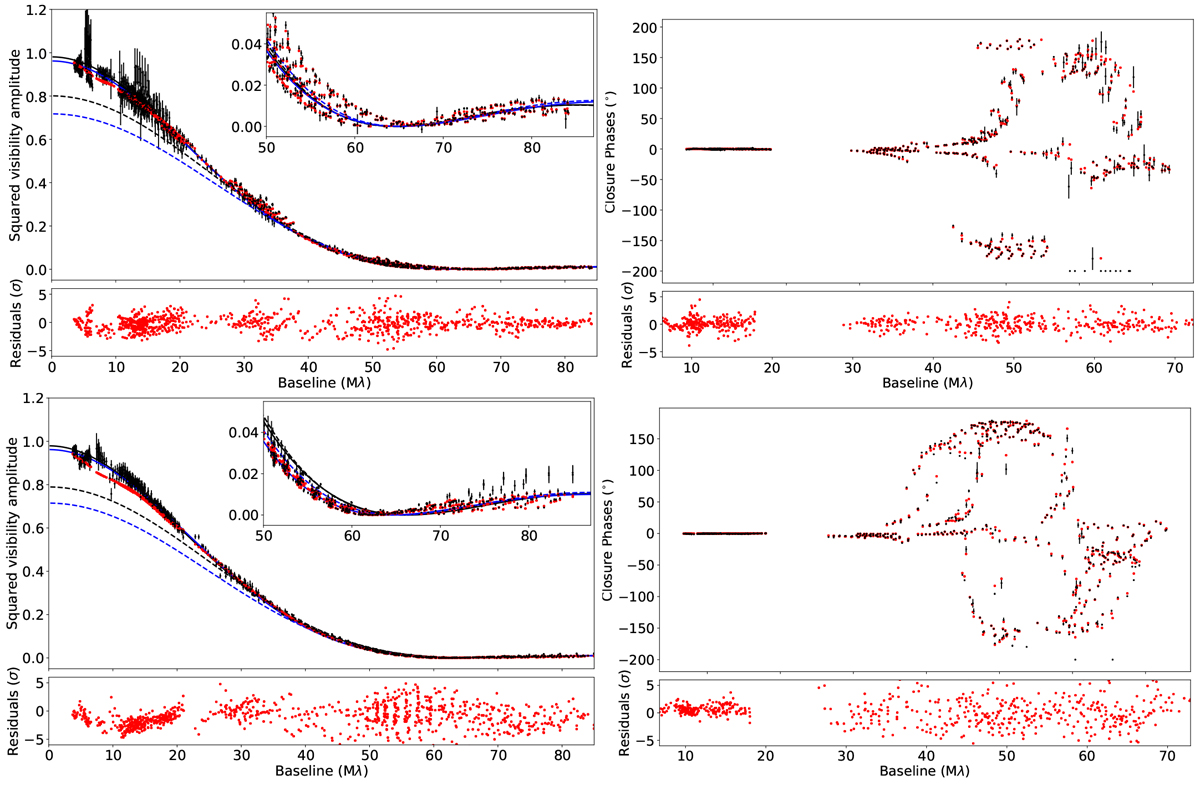
PIONIER visibility results of V602 Car of 2016 (top) and 2019 (bottom) as a function of baseline length. Left panel: squared visibility amplitudes, where the inlay enlarges the part of the low values. Right panel: closure phases. The vertical bars indicate the symmetric error bars. The black solid line denotes our visibility model including the stellar photosphere, represented by a PHOENIX model atmosphere, and a larger uniform disk indicating the extended atmosphere or MOLsphere. The black dashed line indicates the part of the PHOENIX model atmosphere alone without the added uniform disk (MOLsphere). The blue solid and dashed lines represent the same parts, but for the selected 3D RHD snapshots for each epoch instead of the PHOENIX model (see Sect. 5). The synthetic values based on the reconstructed images are shown in red (SQUEEZE algorithm). The small panels below the main panels provide the residuals between observations and reconstructed images.
Current usage metrics show cumulative count of Article Views (full-text article views including HTML views, PDF and ePub downloads, according to the available data) and Abstracts Views on Vision4Press platform.
Data correspond to usage on the plateform after 2015. The current usage metrics is available 48-96 hours after online publication and is updated daily on week days.
Initial download of the metrics may take a while.