Free Access
Fig. B.3
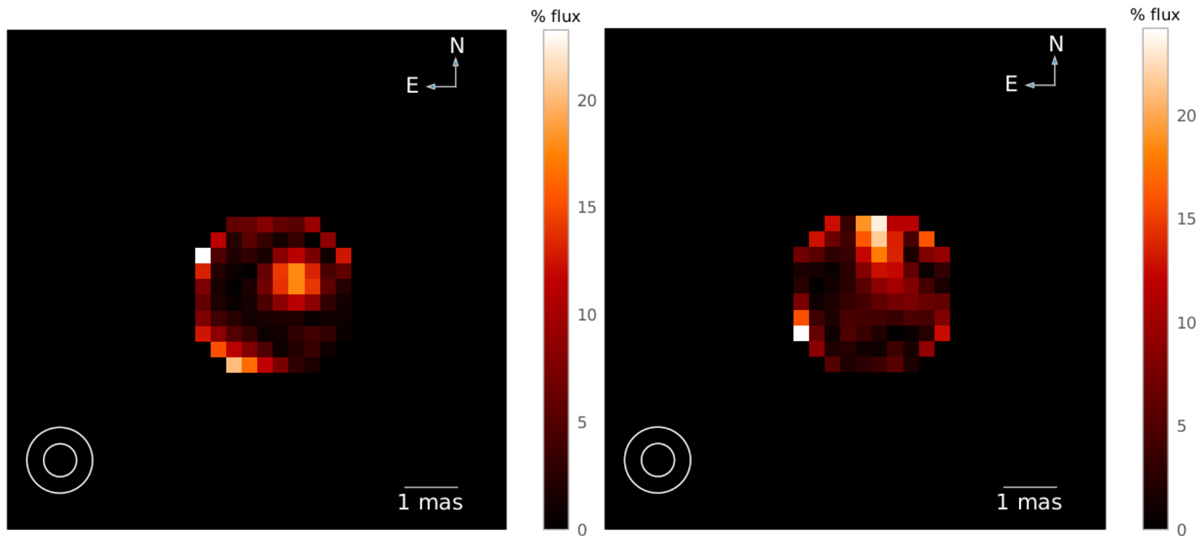
Image resulting from the pixel-by-pixel difference between SQUEEZE and IRBis reconstructions shown in Figs. 3 and B.2. Left: 2016 epoch. Right: 2019 epoch. The scale represents the percentage of flux of the original SQUEEZE image. The same cut-off radius is applied as presented in the main text: 0.75 stellar radii.
Current usage metrics show cumulative count of Article Views (full-text article views including HTML views, PDF and ePub downloads, according to the available data) and Abstracts Views on Vision4Press platform.
Data correspond to usage on the plateform after 2015. The current usage metrics is available 48-96 hours after online publication and is updated daily on week days.
Initial download of the metrics may take a while.