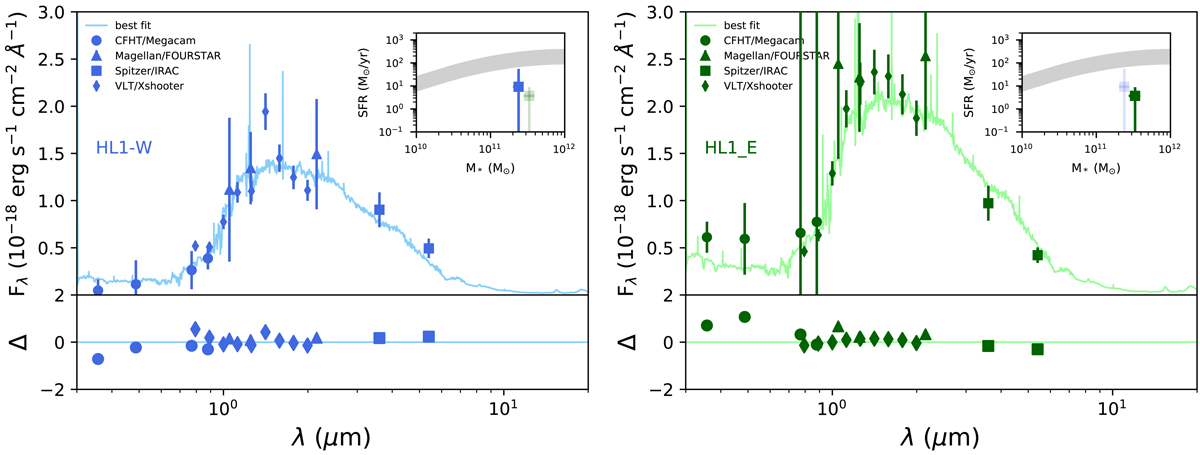
Fig. 8.
SED modeling of the two components of HL1 (HL1-W: left panel, HL1-E: right panel). The fit is performed using the filled symbols, circles are photometric points, and diamonds are points obtained averaging the X-shooter spectra over a range of wavelengths. The best fit to the data is shown as a solid line. The subpanels show the difference between the data points and the best-fit models. In each inset panel, we show the position of the component (plain color) in the SFR-M* diagram along with the MS at z = 1.5 from Schreiber et al. (2015). The position of the second component is also indicated in light color for comparison. Both components are located below the MS.
Current usage metrics show cumulative count of Article Views (full-text article views including HTML views, PDF and ePub downloads, according to the available data) and Abstracts Views on Vision4Press platform.
Data correspond to usage on the plateform after 2015. The current usage metrics is available 48-96 hours after online publication and is updated daily on week days.
Initial download of the metrics may take a while.