Open Access
Fig. 6.
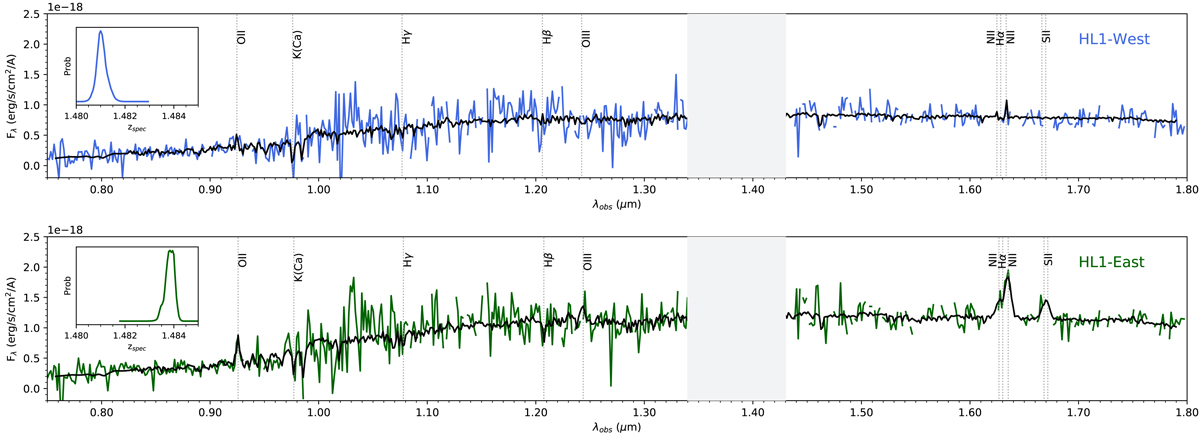
Upper panel: VLT/X-shooter 1D spectra of HL1-West. Lower panel: VLT/X-shooter 1D spectra of HL1-East. The inset panels show the probability distribution function for the redshift. The black lines are the best spectral fits obtained with SLINEFIT.
Current usage metrics show cumulative count of Article Views (full-text article views including HTML views, PDF and ePub downloads, according to the available data) and Abstracts Views on Vision4Press platform.
Data correspond to usage on the plateform after 2015. The current usage metrics is available 48-96 hours after online publication and is updated daily on week days.
Initial download of the metrics may take a while.