Open Access
Fig. 5.
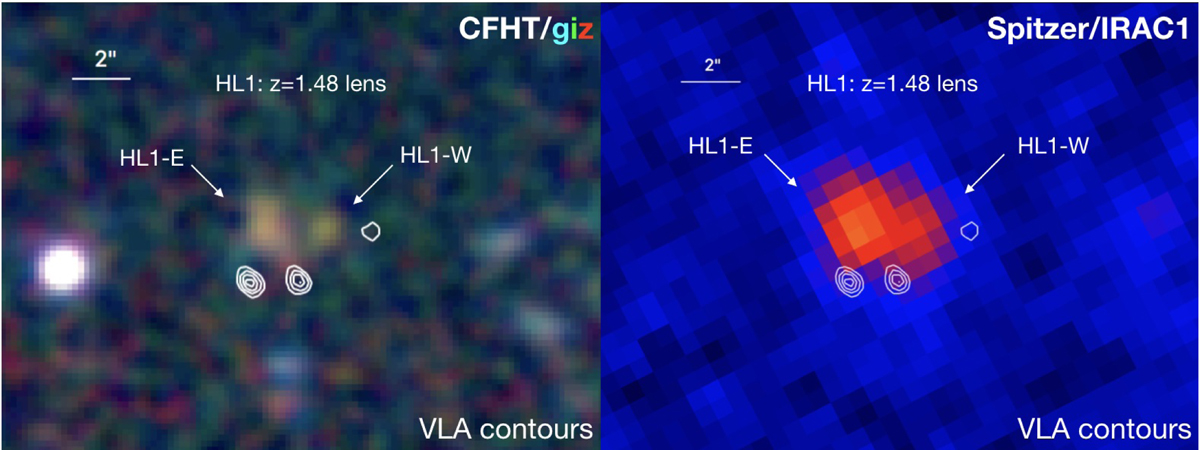
Left panel: CFHT/g′, i′, and z′ band images shown as a RGB image at the position of RV4. Right panel: Spitzer/IRAC1 image centered on the position of RV4. In both panels, the white contours indicate the positions of the three VLA detections. The positions of the z = 1.48 lens system are indicated by the white arrows.
Current usage metrics show cumulative count of Article Views (full-text article views including HTML views, PDF and ePub downloads, according to the available data) and Abstracts Views on Vision4Press platform.
Data correspond to usage on the plateform after 2015. The current usage metrics is available 48-96 hours after online publication and is updated daily on week days.
Initial download of the metrics may take a while.