Open Access
Fig. 4.
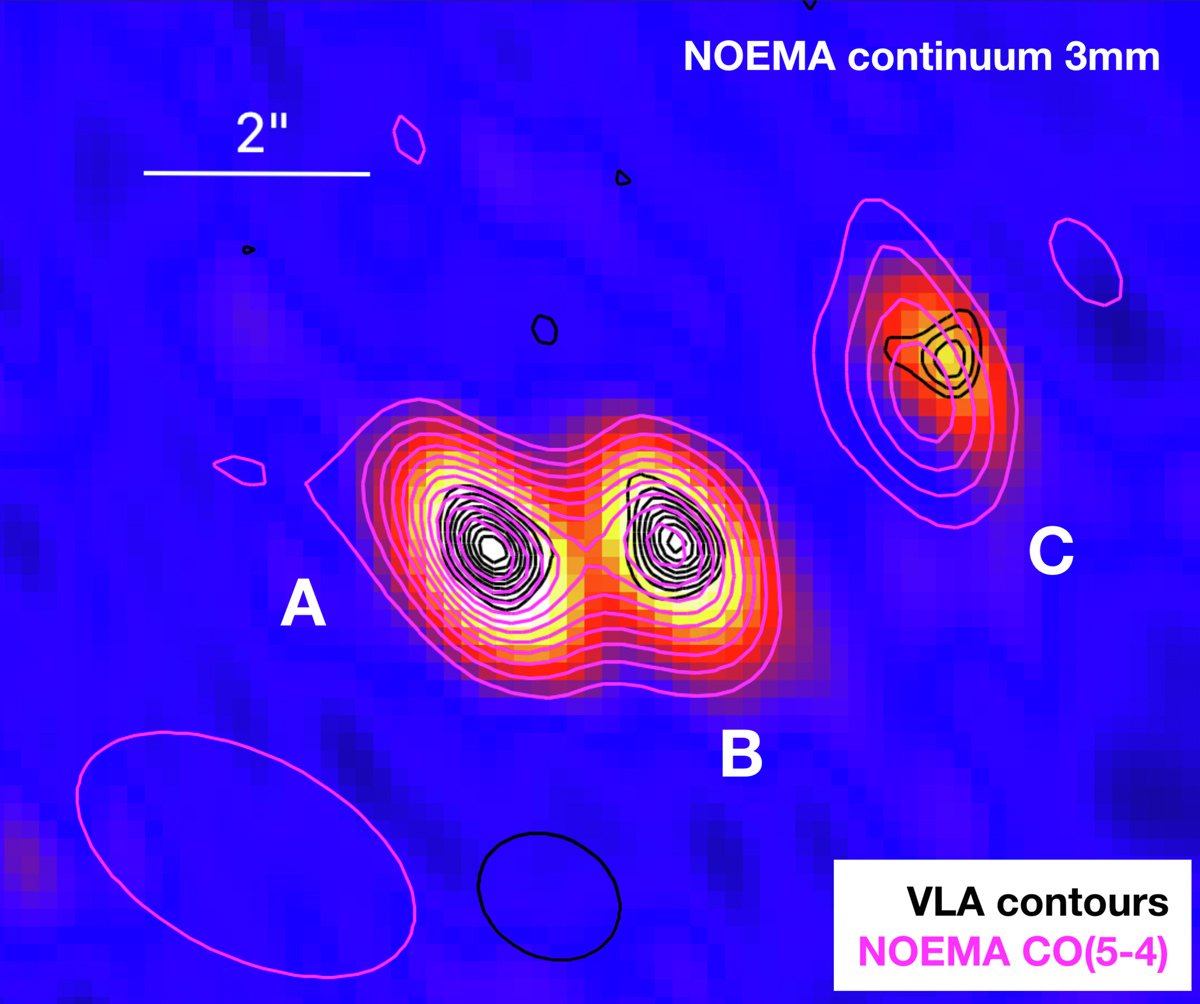
NOEMA 3 mm continuum observation of RV4. The CO(5−4) emission contours are shown in magenta while VLA contours are shown in black for comparison. The VLA and NOEMA beams are indicated by the black and magenta ellipses, respectively.
Current usage metrics show cumulative count of Article Views (full-text article views including HTML views, PDF and ePub downloads, according to the available data) and Abstracts Views on Vision4Press platform.
Data correspond to usage on the plateform after 2015. The current usage metrics is available 48-96 hours after online publication and is updated daily on week days.
Initial download of the metrics may take a while.