Open Access
Fig. 3.
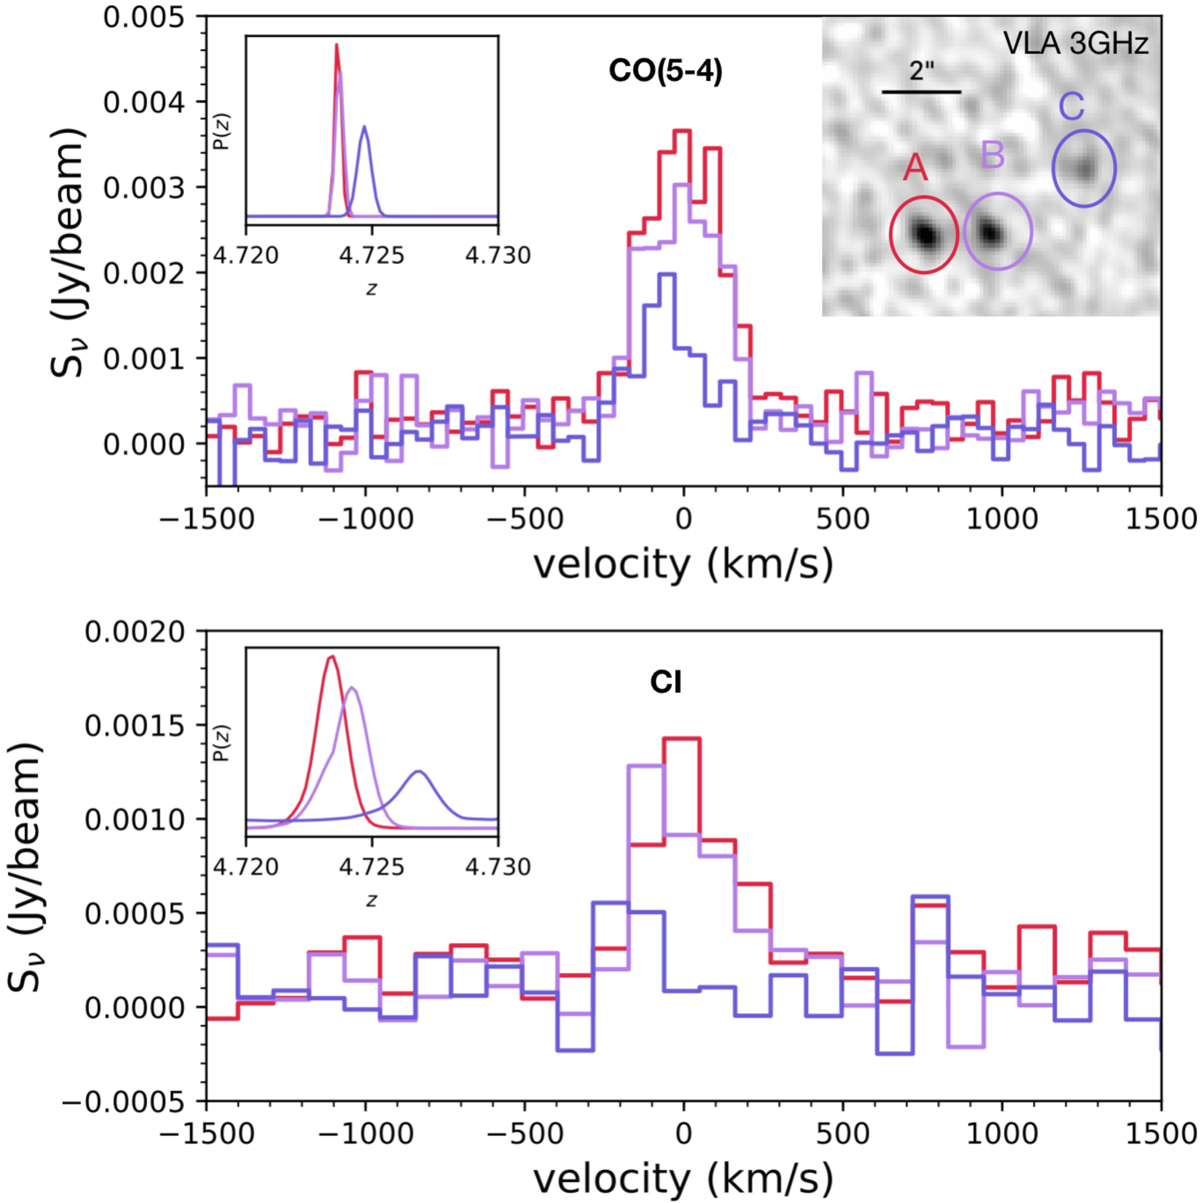
Top panel: NOEMA observations of CO(5−4) lines of blob A (red), B (purple), and C (blue). Inset panel: VLA 3 GHz image of RV4. Bottom panel: [CI](1−0) lines of blob A (red), B (purple), and C (blue). The inset panels show the redshift probability distribution functions obtained with SLINEFIT.
Current usage metrics show cumulative count of Article Views (full-text article views including HTML views, PDF and ePub downloads, according to the available data) and Abstracts Views on Vision4Press platform.
Data correspond to usage on the plateform after 2015. The current usage metrics is available 48-96 hours after online publication and is updated daily on week days.
Initial download of the metrics may take a while.