Open Access
Fig. 2.
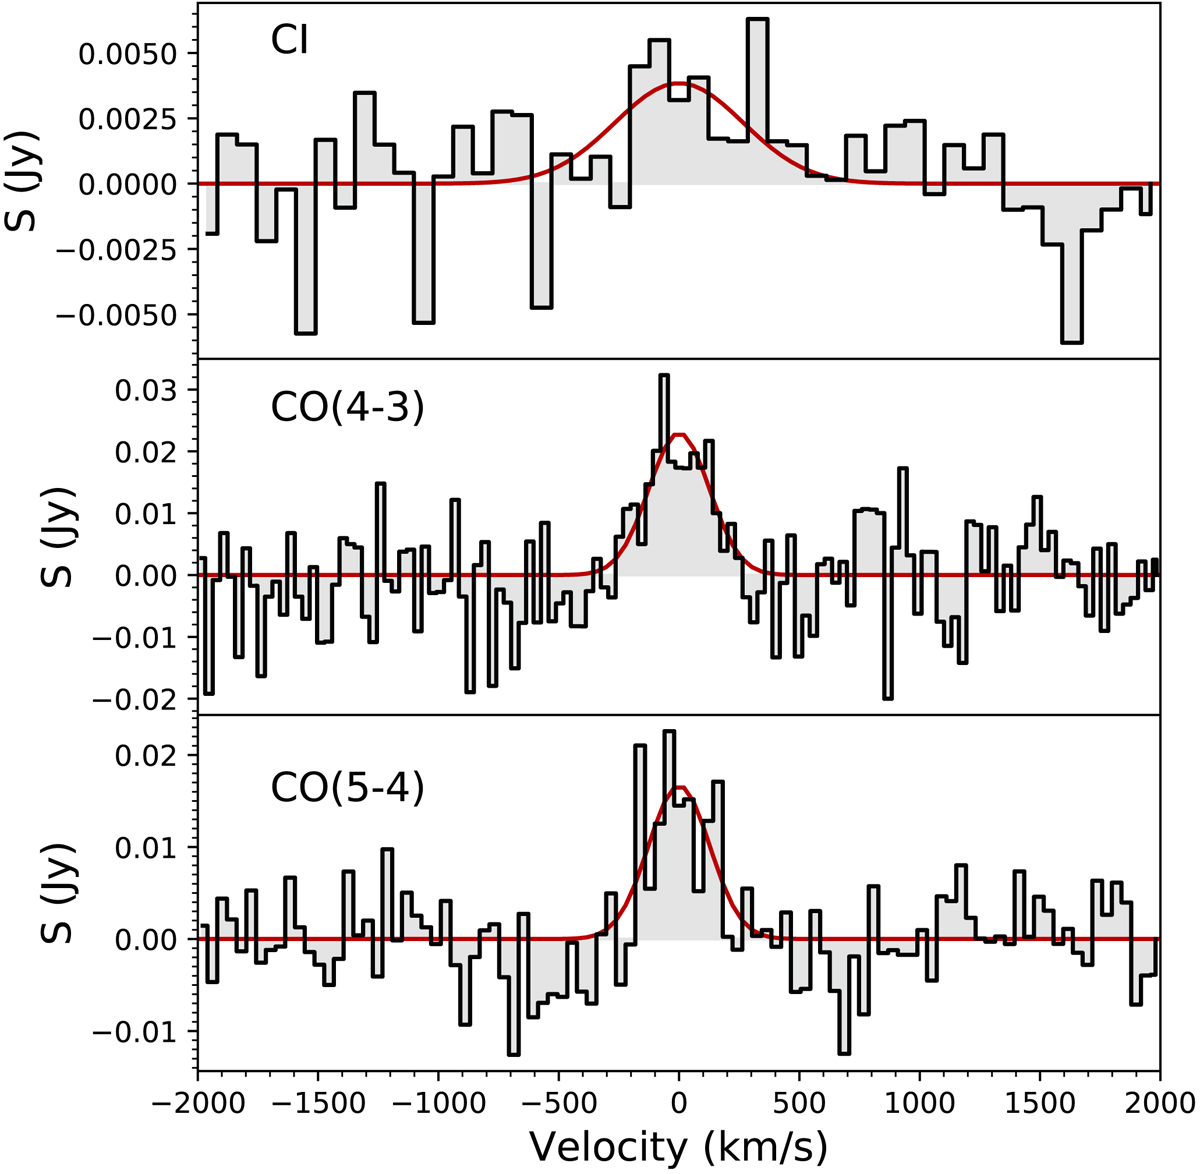
[CI](1−0), CO(4−3), and CO(5−4) emission lines detected with 30 m/EMIR at the RV4 position. They correspond to the integrated emission of the three VLA/NOEMA blobs. The red solid lines shows the best fit of Gaussian.
Current usage metrics show cumulative count of Article Views (full-text article views including HTML views, PDF and ePub downloads, according to the available data) and Abstracts Views on Vision4Press platform.
Data correspond to usage on the plateform after 2015. The current usage metrics is available 48-96 hours after online publication and is updated daily on week days.
Initial download of the metrics may take a while.