Fig. 14.
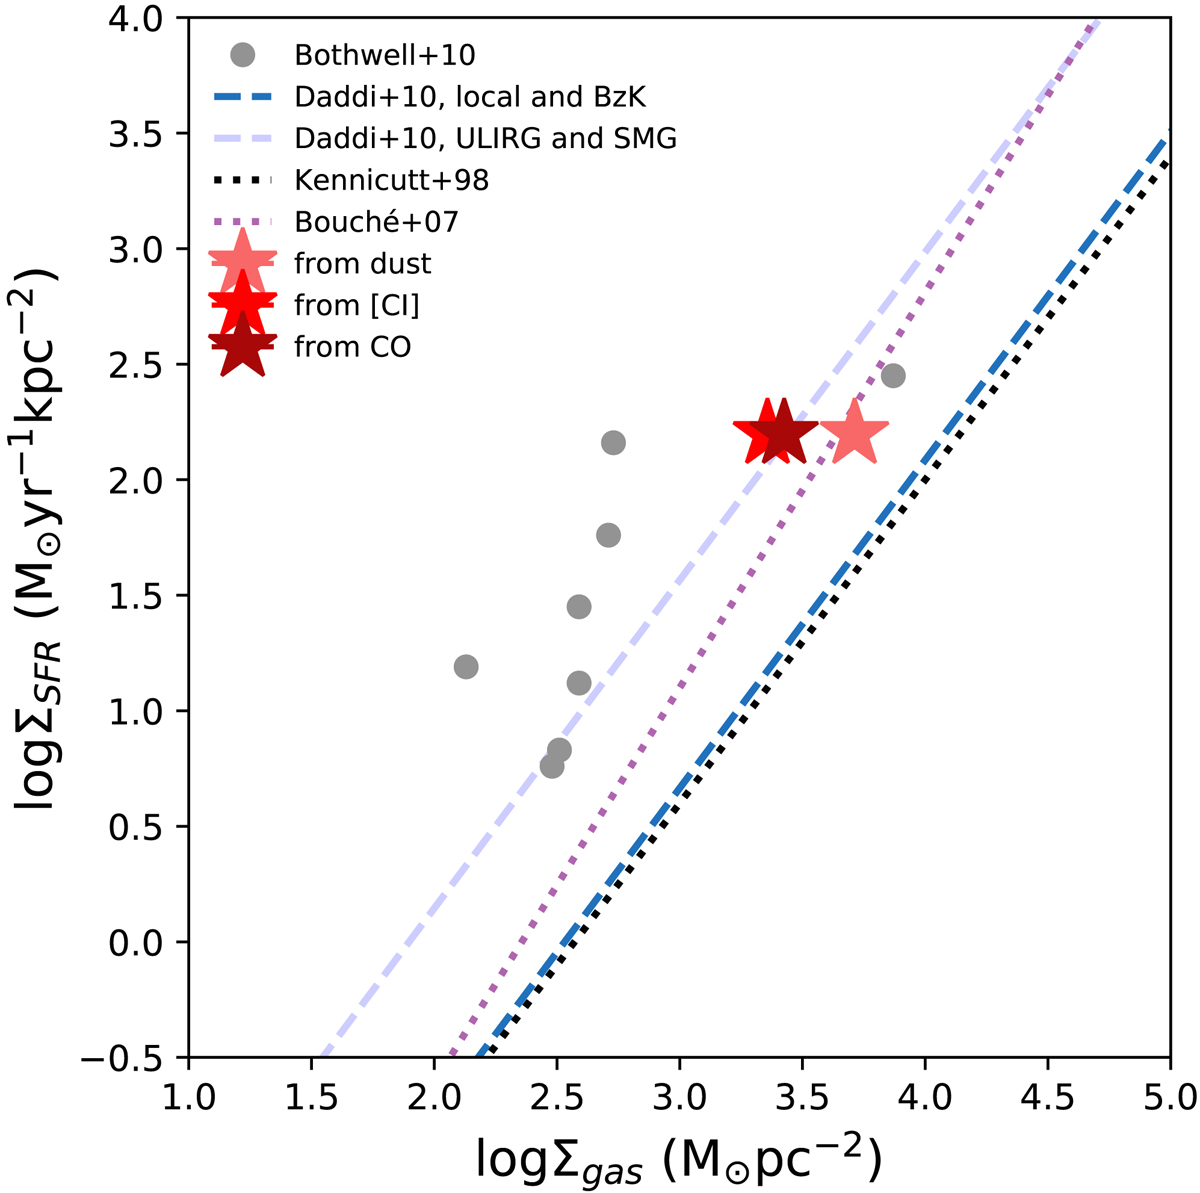
Star formation rate surface density as a function of gas surface density. The position of RV4 is marker by the red stars. The different colors correspond to the method used to derive the gas mass: light red using the dust mass, red using [CI], and dark red using CO. The grey points are the SPT data from Bothwell et al. (2010) which properties are similar to RV4’s. The black dotted line is the Kennicutt (1998) relation and the purple dotted line the updated relation from Bouché et al. (2007). The blue and light blue dashed lines are the relation of Daddi et al. (2010b) for BzK and SMG galaxies, respectively.
Current usage metrics show cumulative count of Article Views (full-text article views including HTML views, PDF and ePub downloads, according to the available data) and Abstracts Views on Vision4Press platform.
Data correspond to usage on the plateform after 2015. The current usage metrics is available 48-96 hours after online publication and is updated daily on week days.
Initial download of the metrics may take a while.