Fig. 13.
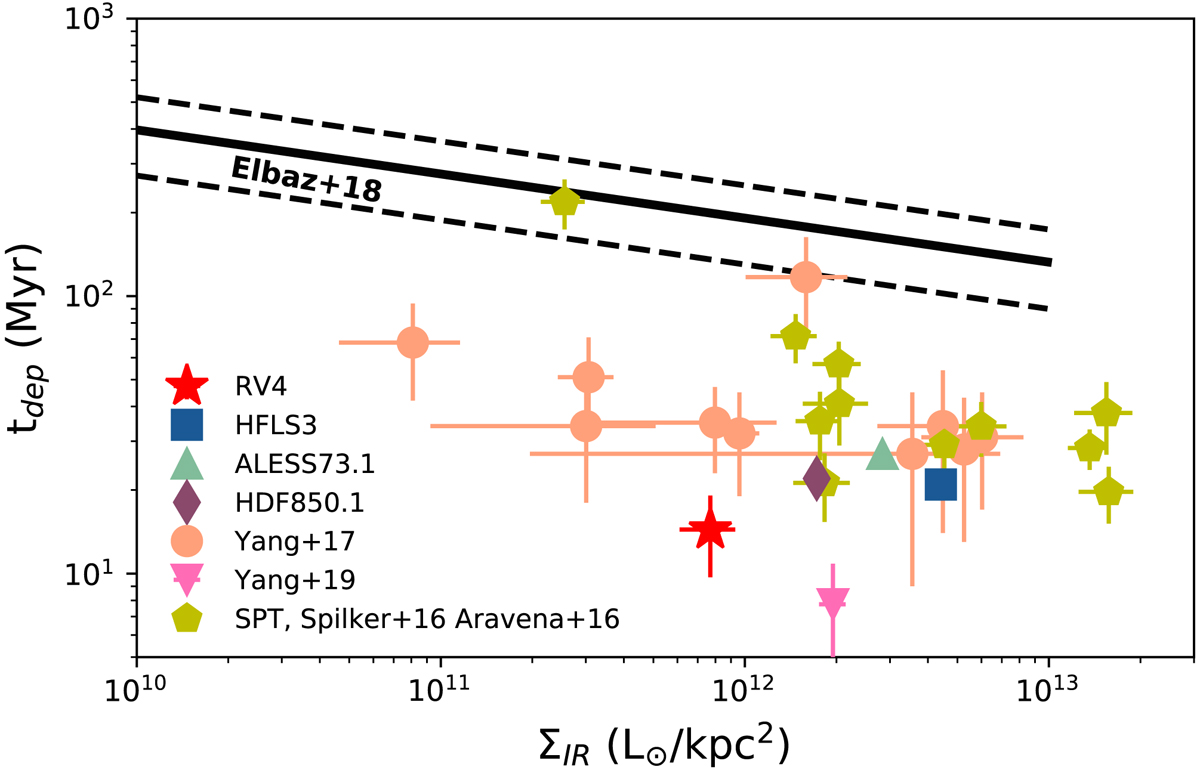
Depletion time as a function of IR surface brightness. The position of RV4 is indicated by the red cross. The depletion time is the one computed from the gas mass estimated from [CI] (Sect. 4.2). The blue square is HFLS3 (Riechers et al. 2013) at z = 6.34, the green triangle is ALESS73.1 at z = 4.76 (De Breuck et al. 2014), the purple diamond is HDF850.1 (Neri et al. 2014) at z = 5.19, and the pink downward triangle is the source of Yang et al. (2019b) at z = 6.5. The orange dots are the strongly lensed sample of SMG of Yang et al. (2017) spanning a redshift range between 2.09 and 4.24. The yellow pentagons are SPT sources from Spilker et al. (2016) and Aravena et al. (2016). The relation obtained for a sample of MS galaxies at z = 2 by Elbaz et al. (2018) is shown in black solid and dashed lines in the ΣIR range probed by their data.
Current usage metrics show cumulative count of Article Views (full-text article views including HTML views, PDF and ePub downloads, according to the available data) and Abstracts Views on Vision4Press platform.
Data correspond to usage on the plateform after 2015. The current usage metrics is available 48-96 hours after online publication and is updated daily on week days.
Initial download of the metrics may take a while.