Fig. 12.
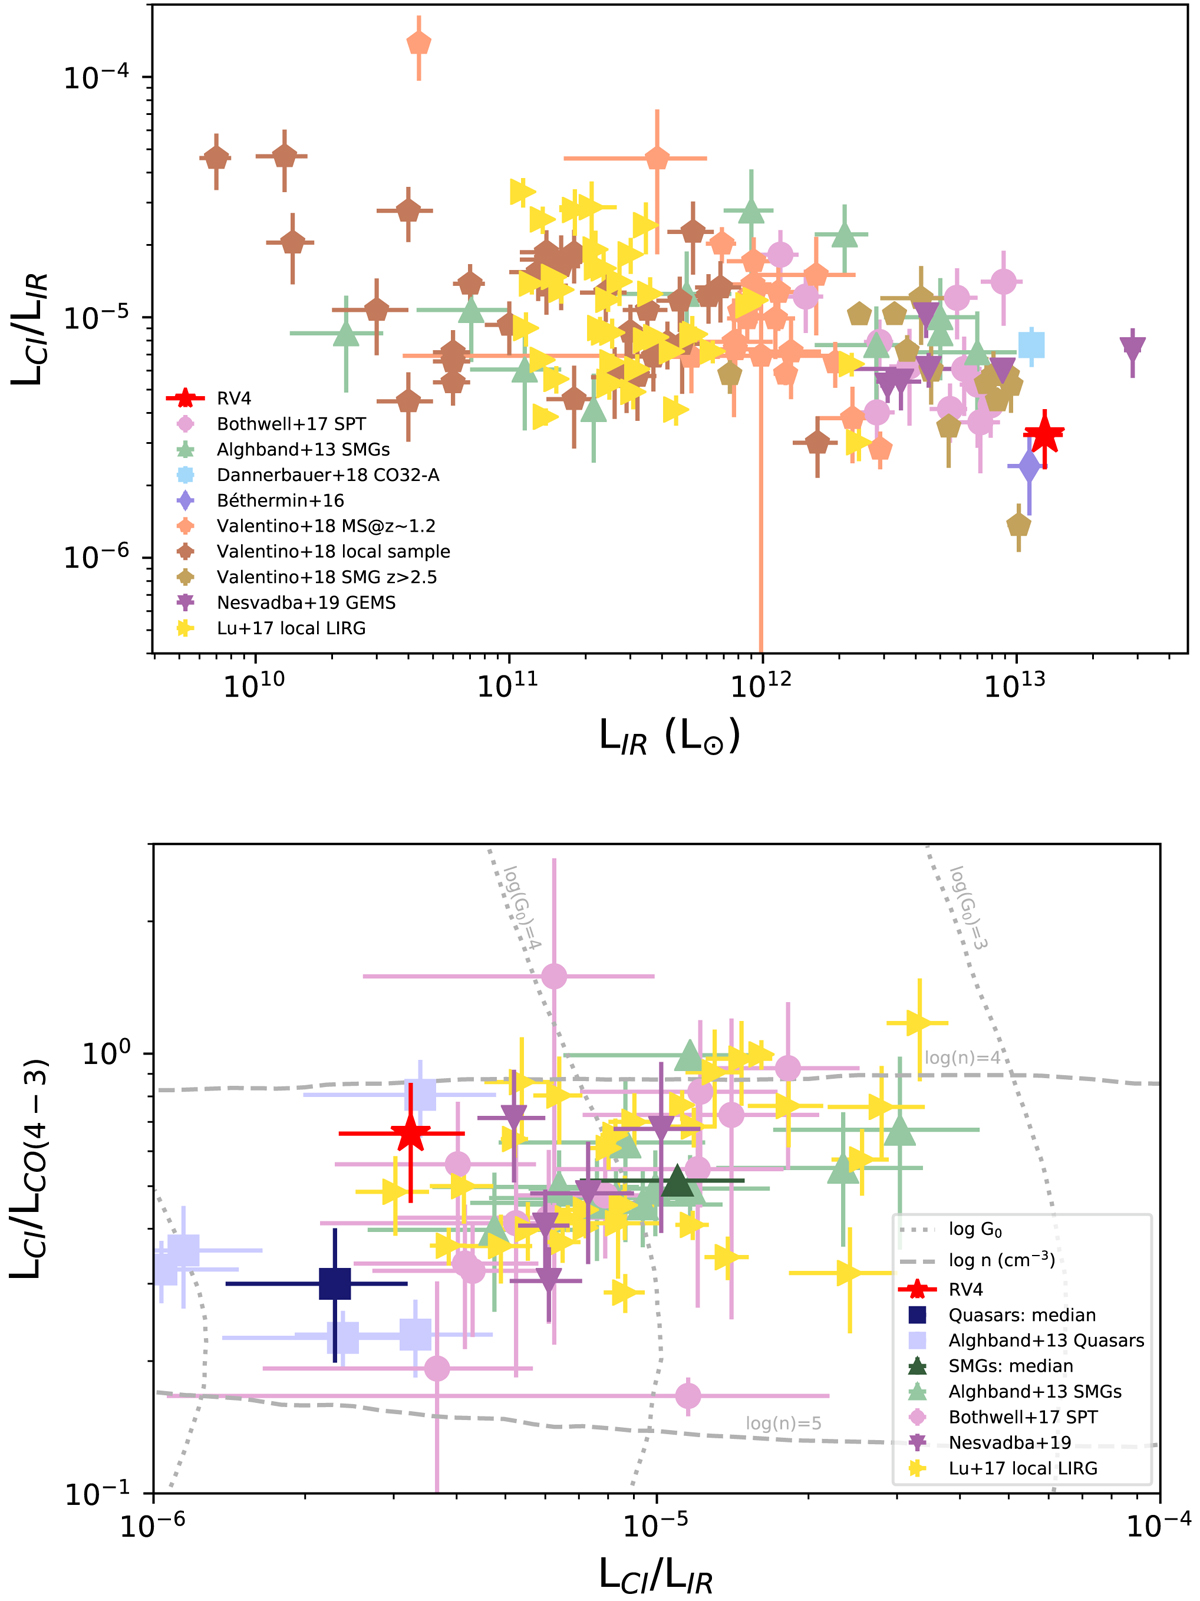
Upper panel: [CI] to LIR luminosity ratio (both in L⊙) as a function of infrared luminosity, corrected for lensing magnification when needed, for several samples. The position of RV4 is indicated by the red star. For comparison we show the samples gathered by Valentino et al. (2018) (high-z MS, SMG, and local galaxies), the SPT sample of Bothwell et al. (2017), the SMG sample of Alaghband-Zadeh et al. (2013), the galaxy CO32-A (Dannerbauer et al. 2019), SPT-S J213242-5802.9 (Béthermin et al. 2016), Planck’s dusty GEMS (Nesvadba et al. 2019), and the local LIRG sample of Lu et al. (2017). Lower panel: [CI] to CO(4−3) luminosity ratio versus [CI] to IR luminosity ratio (L⊙). The position of RV4 is marked by the red star. This figure is adapted from Alaghband-Zadeh et al. (2013). Their SMG sample is shown (green triangles) as well as its median position (dark green triangle). The blue squares indicate the quasar sample presented in Walter et al. (2011) with the dark blue square indicating the position of the median of their sample. The SPT sample of Bothwell et al. (2017), Planck’s dusty GEMS (Cañameras et al. 2018; Nesvadba et al. 2019), and the local sample of LIRGs studied in Lu et al. (2017) are also shown in the figure. The grey lines indicate the contours of the gas density (n) and the radiation field (G0) for the corresponding LCI/LCO(4−3) and LCI/LIR ratios, as produced by the PDR models of Kaufman et al. (1999).
Current usage metrics show cumulative count of Article Views (full-text article views including HTML views, PDF and ePub downloads, according to the available data) and Abstracts Views on Vision4Press platform.
Data correspond to usage on the plateform after 2015. The current usage metrics is available 48-96 hours after online publication and is updated daily on week days.
Initial download of the metrics may take a while.