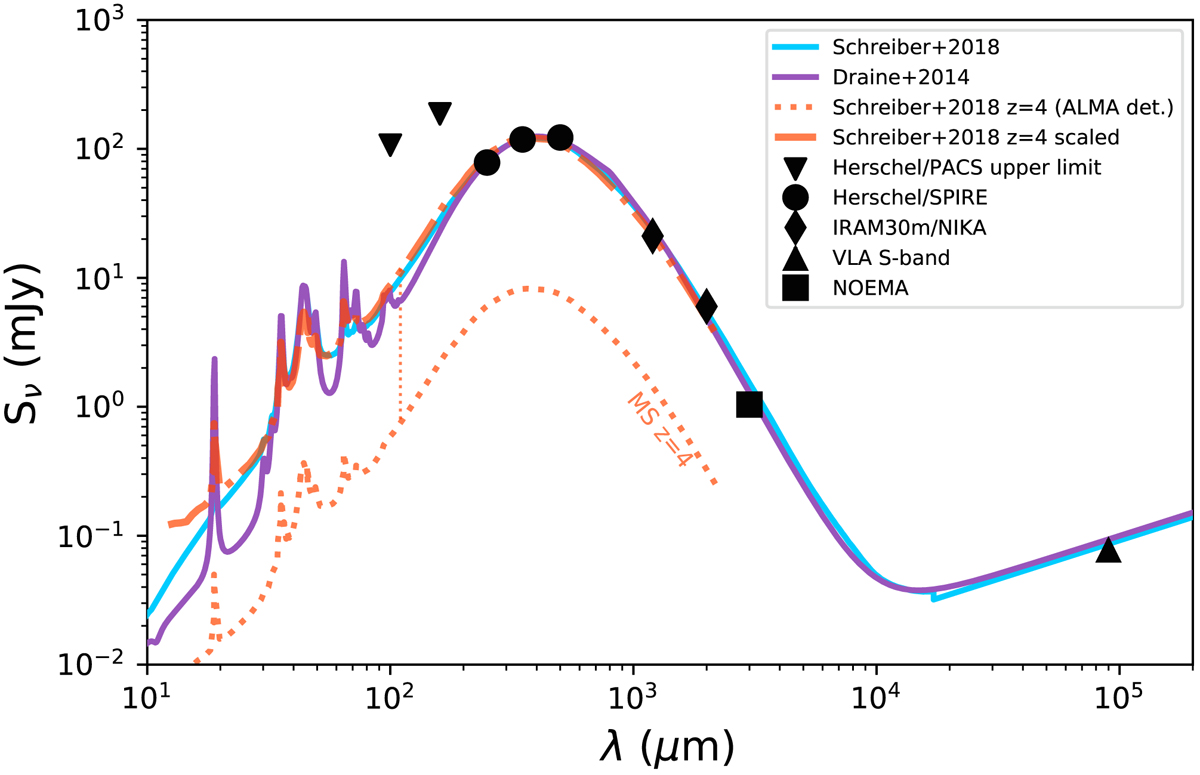
Fig. 10.
IR SED modeling of RV4. The flux densities are not corrected from magnification. Black circles are the SPIRE data, while diamonds and triangle are the NIKA and VLA fluxes, respectively. The downward triangles indicate the non detection from PACS. The IR SED was fit using the IR libraries of Schreiber et al. (2018) (light blue) and Draine et al. (2014) (purple). The MS IR SED derived by Schreiber et al. (2017) from a sample of ALMA detected z = 4 sources is shown with the dashed orange line. A scaling of this MS SED to the 350 μm flux of RV4 leads to a scaling factor of 14.8.
Current usage metrics show cumulative count of Article Views (full-text article views including HTML views, PDF and ePub downloads, according to the available data) and Abstracts Views on Vision4Press platform.
Data correspond to usage on the plateform after 2015. The current usage metrics is available 48-96 hours after online publication and is updated daily on week days.
Initial download of the metrics may take a while.