Free Access
Fig. 21.
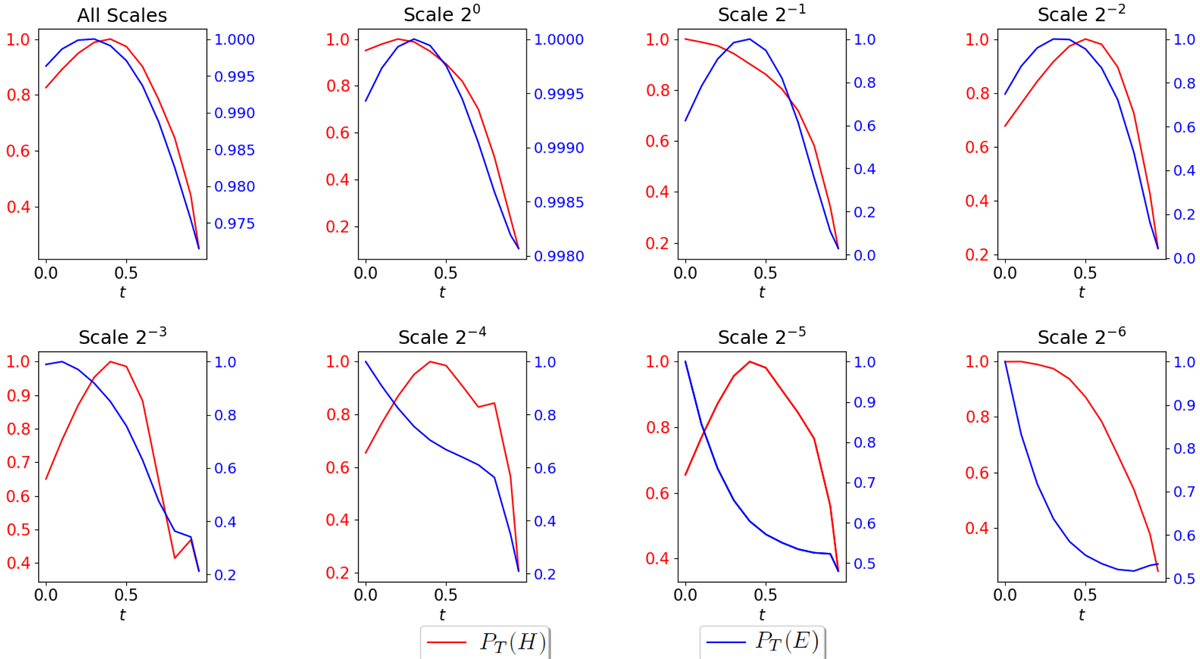
Temporal evolution of PT for 𝒜 (field line helicity) and E (magnetic energy). Each panel represents a scale s (except the first with is the total over all scales). The normalisation is scale dependent.
Current usage metrics show cumulative count of Article Views (full-text article views including HTML views, PDF and ePub downloads, according to the available data) and Abstracts Views on Vision4Press platform.
Data correspond to usage on the plateform after 2015. The current usage metrics is available 48-96 hours after online publication and is updated daily on week days.
Initial download of the metrics may take a while.