Fig. 4.
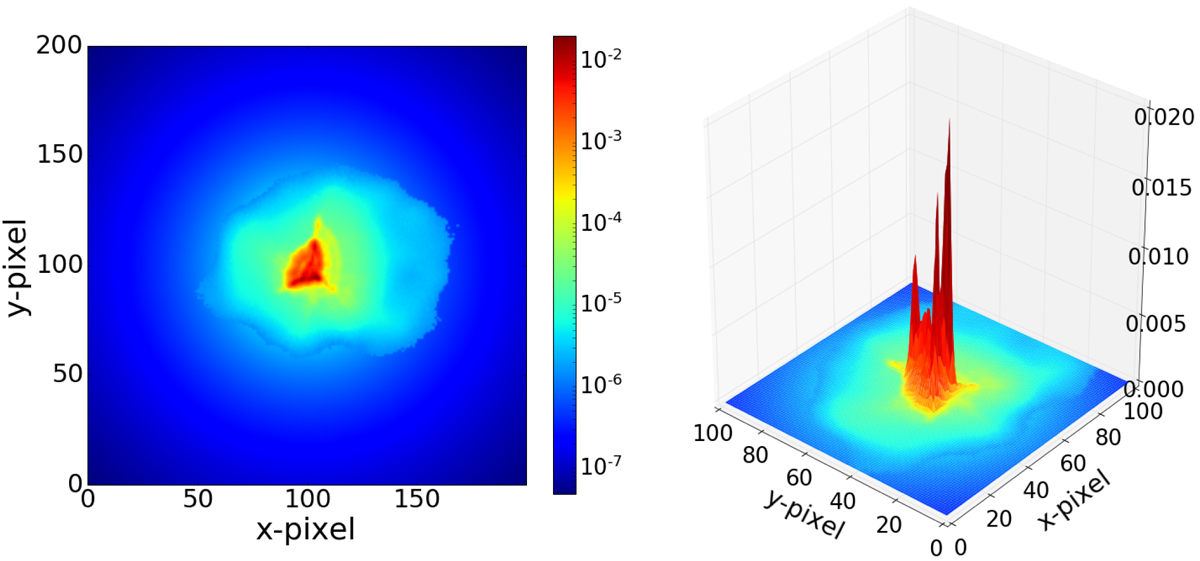
Point spread function from laboratory measurements performed during the CHEOPS on-ground calibration. Despite smoothing with a bilateral filter, the tails of the PSF measurement are affected by noise, and have therefore been replaced with a 1/r3 function for pixels below a threshold value. The image is normalised such that the sum over all pixels is 1. The field corresponds to 3.33 × 3.33 arcmin on the sky. The right plot shows a zoom on the central 100 × 100 pixels in 3D, illustrating more clearly the presence of spikes.
Current usage metrics show cumulative count of Article Views (full-text article views including HTML views, PDF and ePub downloads, according to the available data) and Abstracts Views on Vision4Press platform.
Data correspond to usage on the plateform after 2015. The current usage metrics is available 48-96 hours after online publication and is updated daily on week days.
Initial download of the metrics may take a while.