Fig. 13.
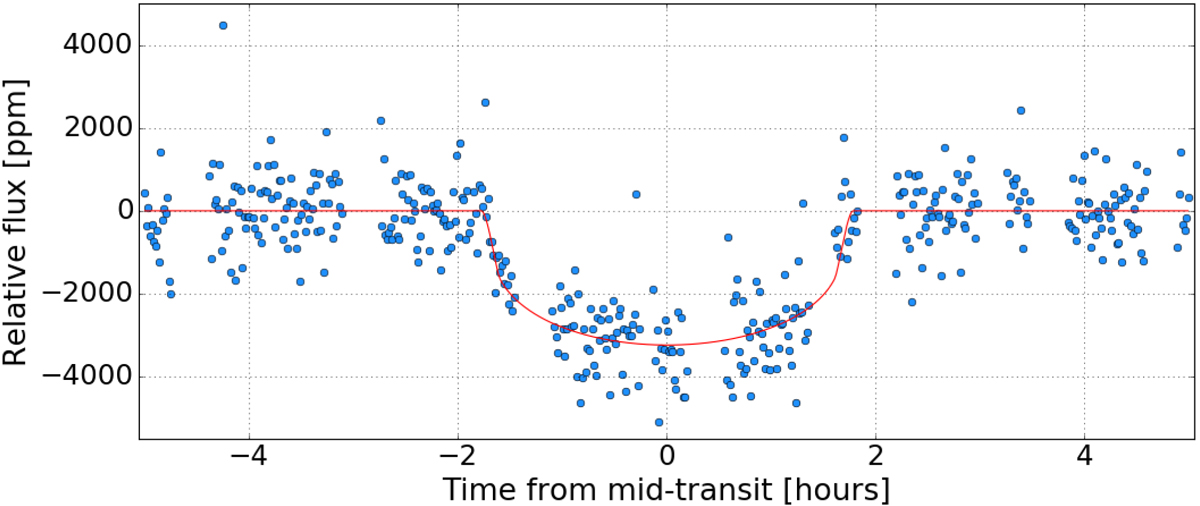
Light curve extracted from a CHEOPSim image time series, using photometric extraction performed by the data reduction pipeline that will be used with real CHEOPS data, for a Neptune-sized planet orbiting a V = 12 K5V star with a 13 day orbital period. The exposure duration is 60 s and exposures are not stacked. Gaps in the light curve correspond to interruptions due to Earth occultation (once per CHEOPS orbit). The simulated photon flux incident on the telescope is shown by the red line. Stellar granulation was not simulated, resulting in a smooth curve.
Current usage metrics show cumulative count of Article Views (full-text article views including HTML views, PDF and ePub downloads, according to the available data) and Abstracts Views on Vision4Press platform.
Data correspond to usage on the plateform after 2015. The current usage metrics is available 48-96 hours after online publication and is updated daily on week days.
Initial download of the metrics may take a while.