Fig. 14
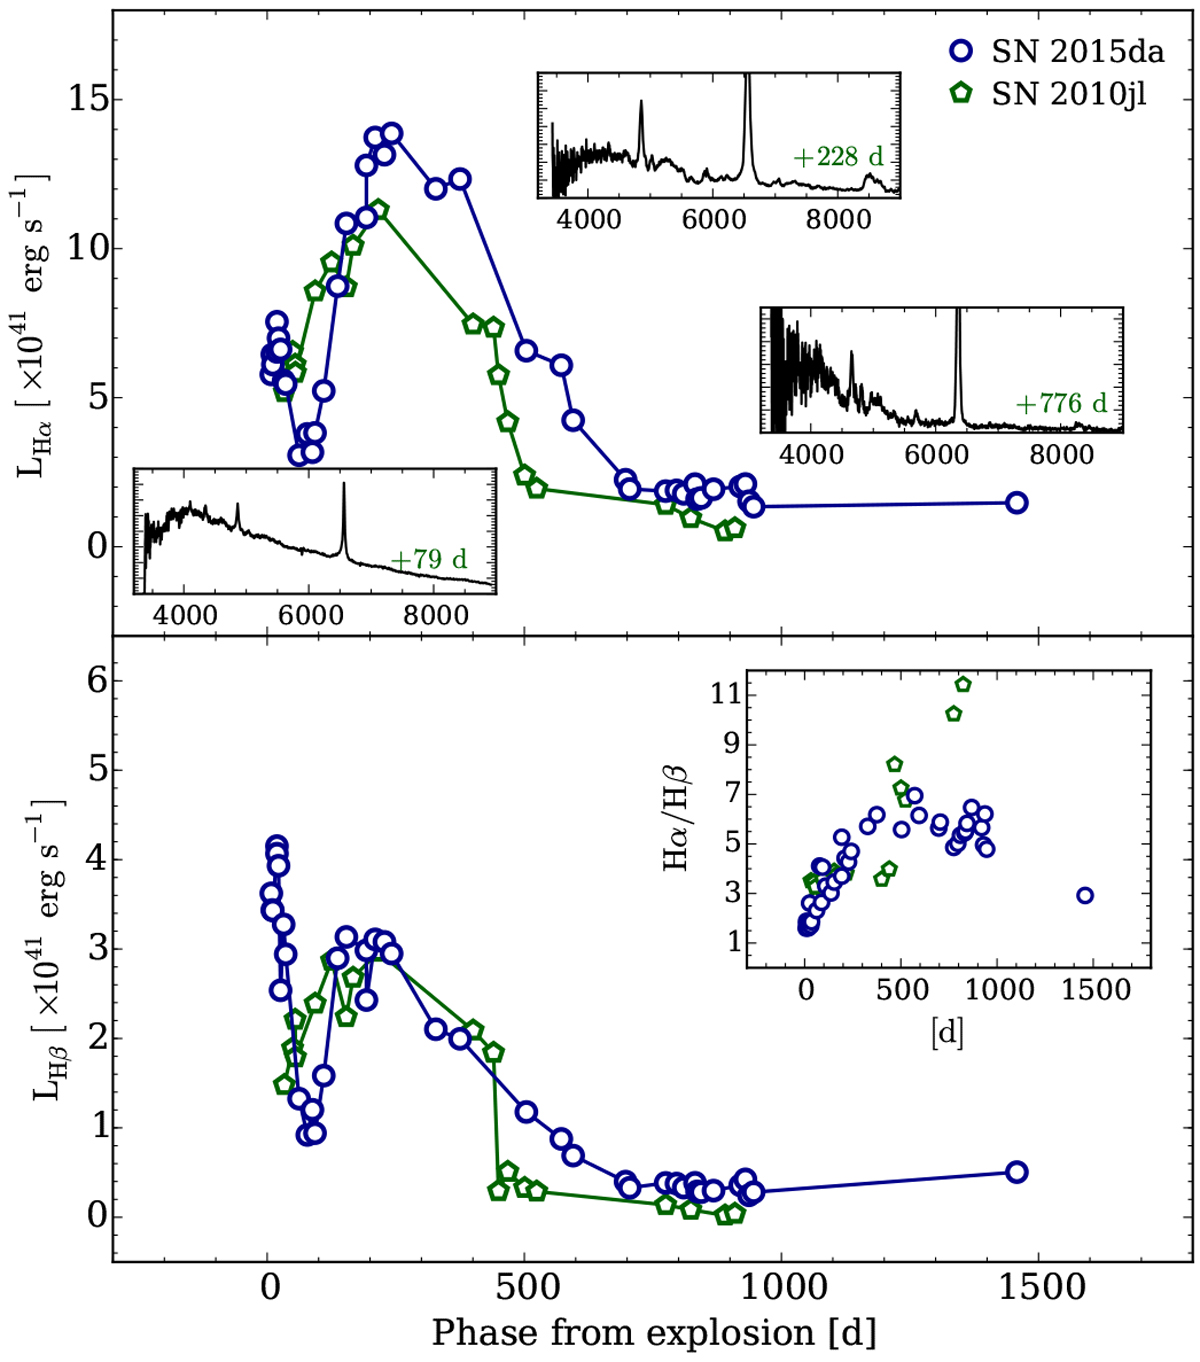
Evolution of the integrated luminosity of the most prominent Balmer lines (Hα and Hβ) compared to those inferred for SN 2010jl. Insets in the upper panel show representative spectra during the different phases of the evolution of SN 2015da. The inset in the bottom panel shows the evolution of the Hα/Hβ ratio compared to that computed for SN 2010jl.
Current usage metrics show cumulative count of Article Views (full-text article views including HTML views, PDF and ePub downloads, according to the available data) and Abstracts Views on Vision4Press platform.
Data correspond to usage on the plateform after 2015. The current usage metrics is available 48-96 hours after online publication and is updated daily on week days.
Initial download of the metrics may take a while.