Open Access
Fig. 8.
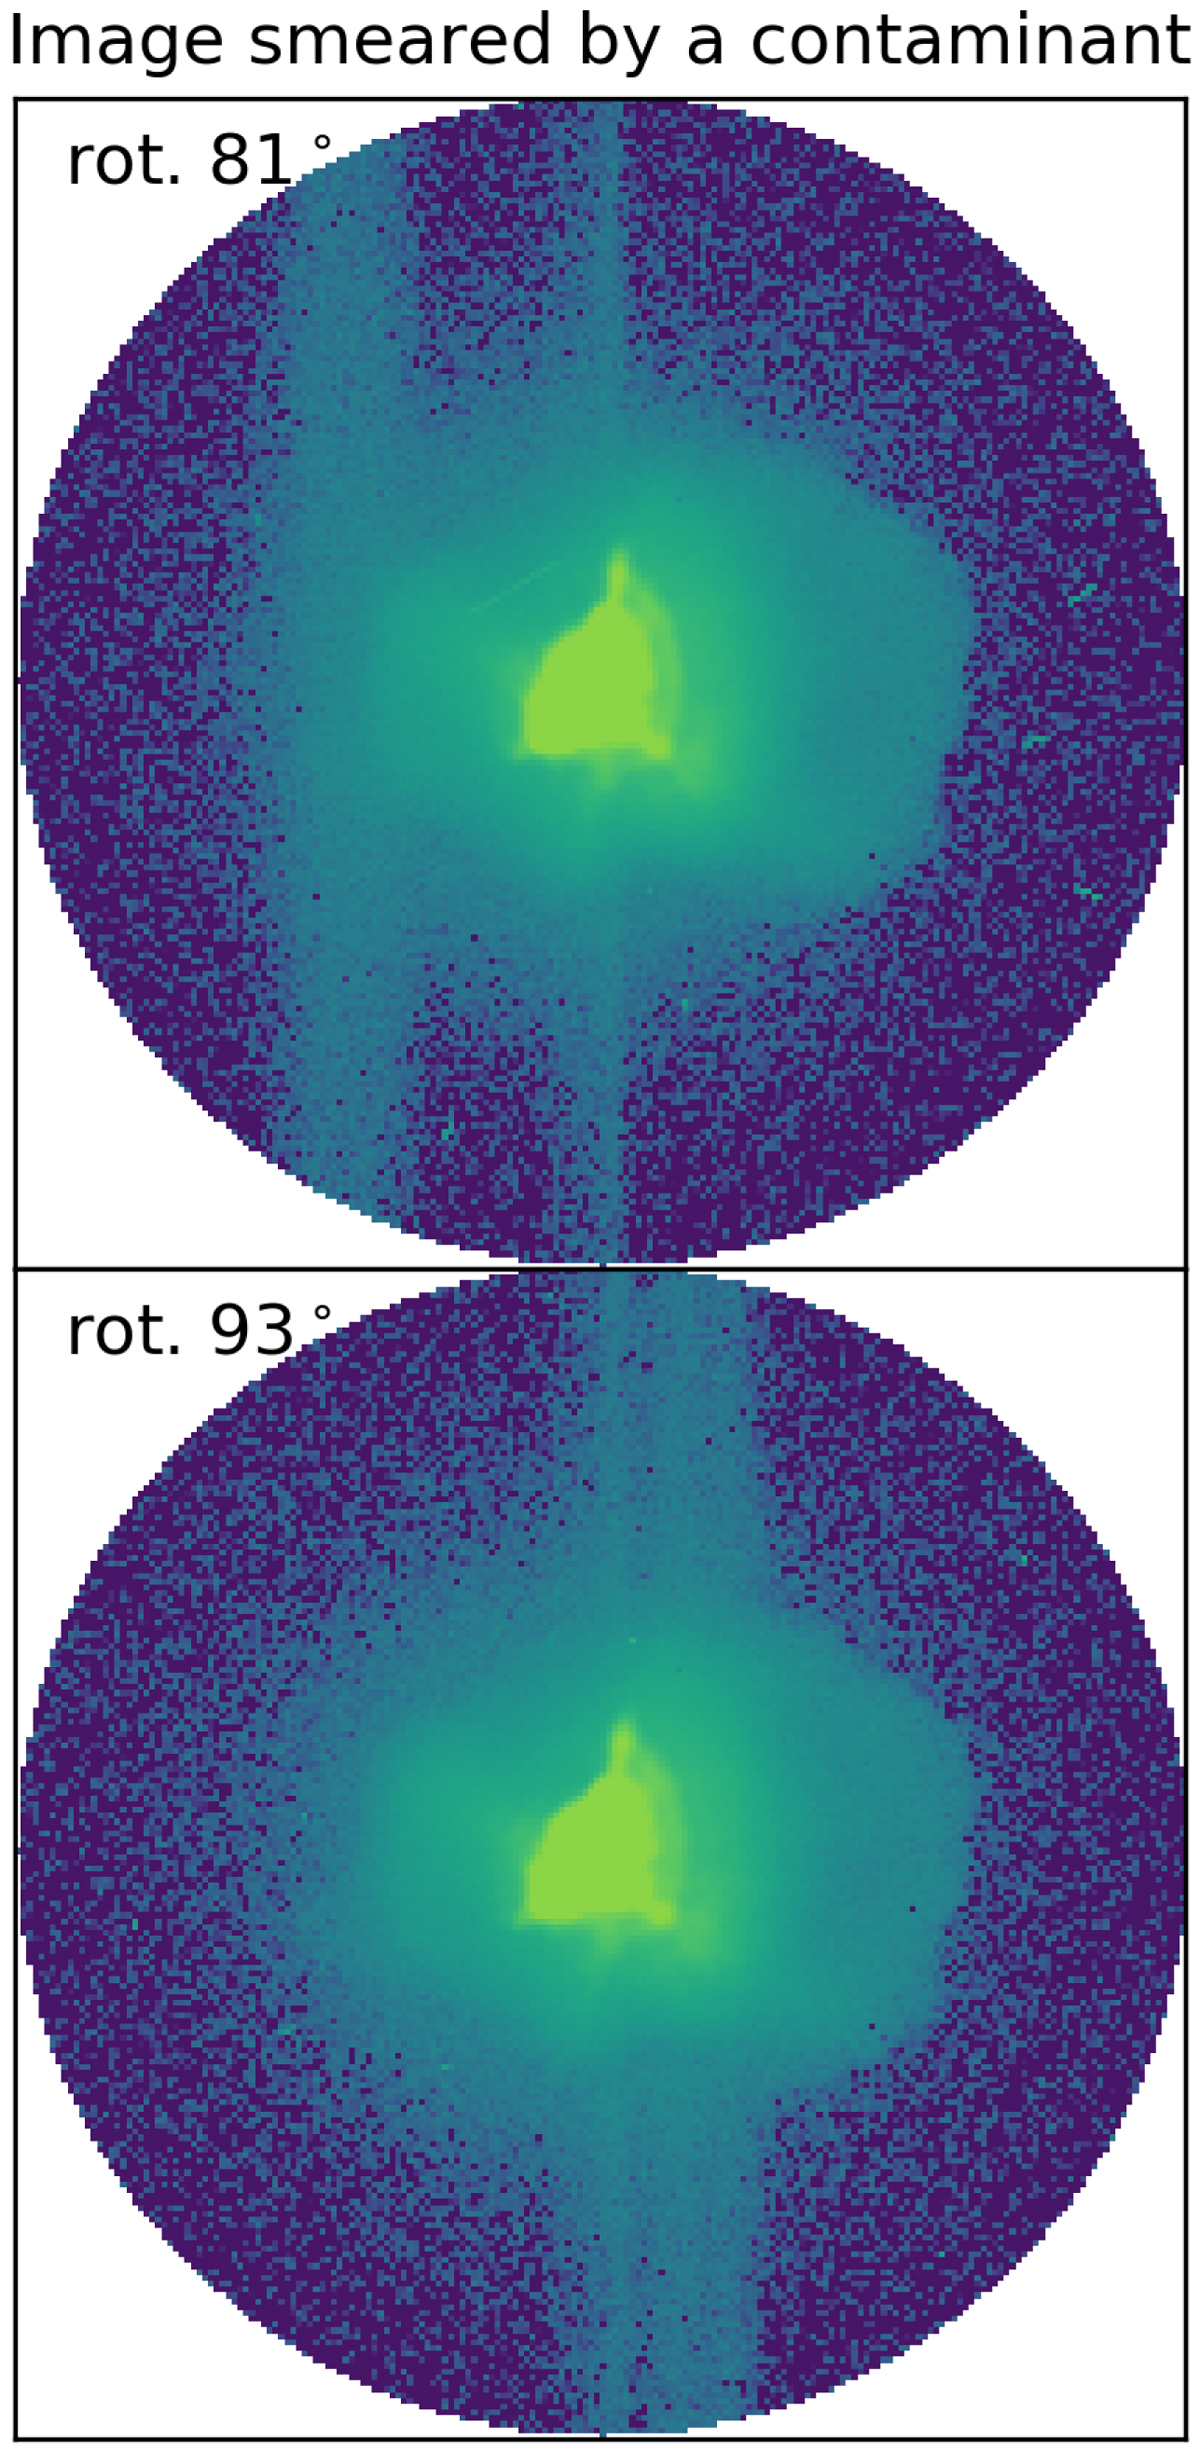
Examples of smear trails in the subarray. The two images correspond to a different roll angles of one contaminant star of V-mag = 7 rotating around a V-mag = 9 target outside the subarray. Each exposure is labeled with its respective roll angle and a logarithmic scale was used for better visualization.
Current usage metrics show cumulative count of Article Views (full-text article views including HTML views, PDF and ePub downloads, according to the available data) and Abstracts Views on Vision4Press platform.
Data correspond to usage on the plateform after 2015. The current usage metrics is available 48-96 hours after online publication and is updated daily on week days.
Initial download of the metrics may take a while.