Open Access
Fig. 7.
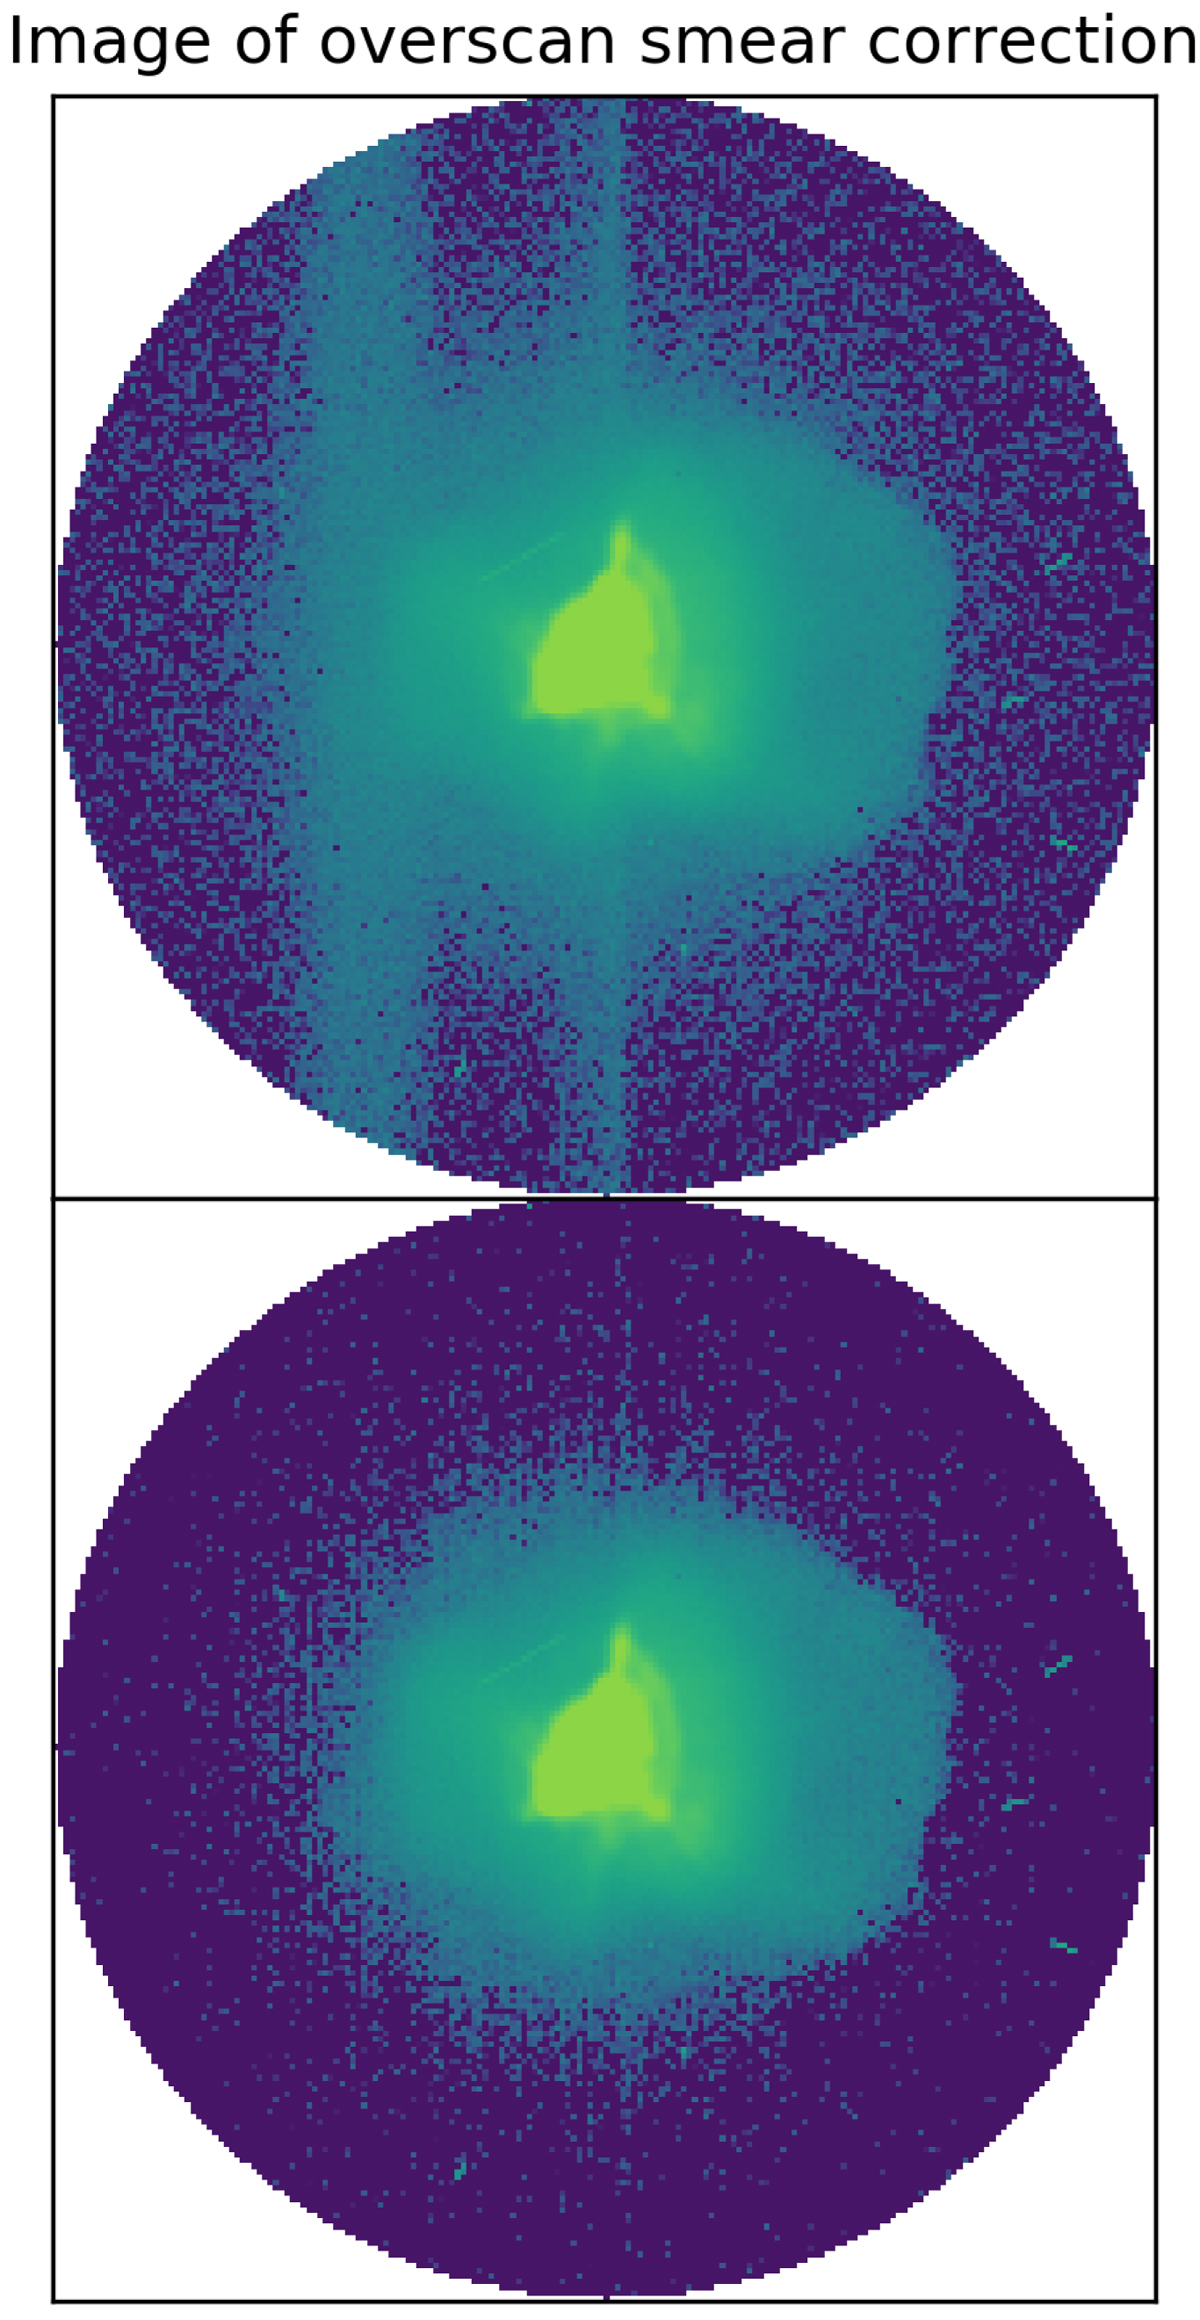
Example of smear correction. Top: simulated 200 × 200 exposure of a V-mag = 9 target and one external contaminant. Bottom: same exposure after smear correction. The color scale has been adapted for better visualization.
Current usage metrics show cumulative count of Article Views (full-text article views including HTML views, PDF and ePub downloads, according to the available data) and Abstracts Views on Vision4Press platform.
Data correspond to usage on the plateform after 2015. The current usage metrics is available 48-96 hours after online publication and is updated daily on week days.
Initial download of the metrics may take a while.