Open Access
Fig. 14.
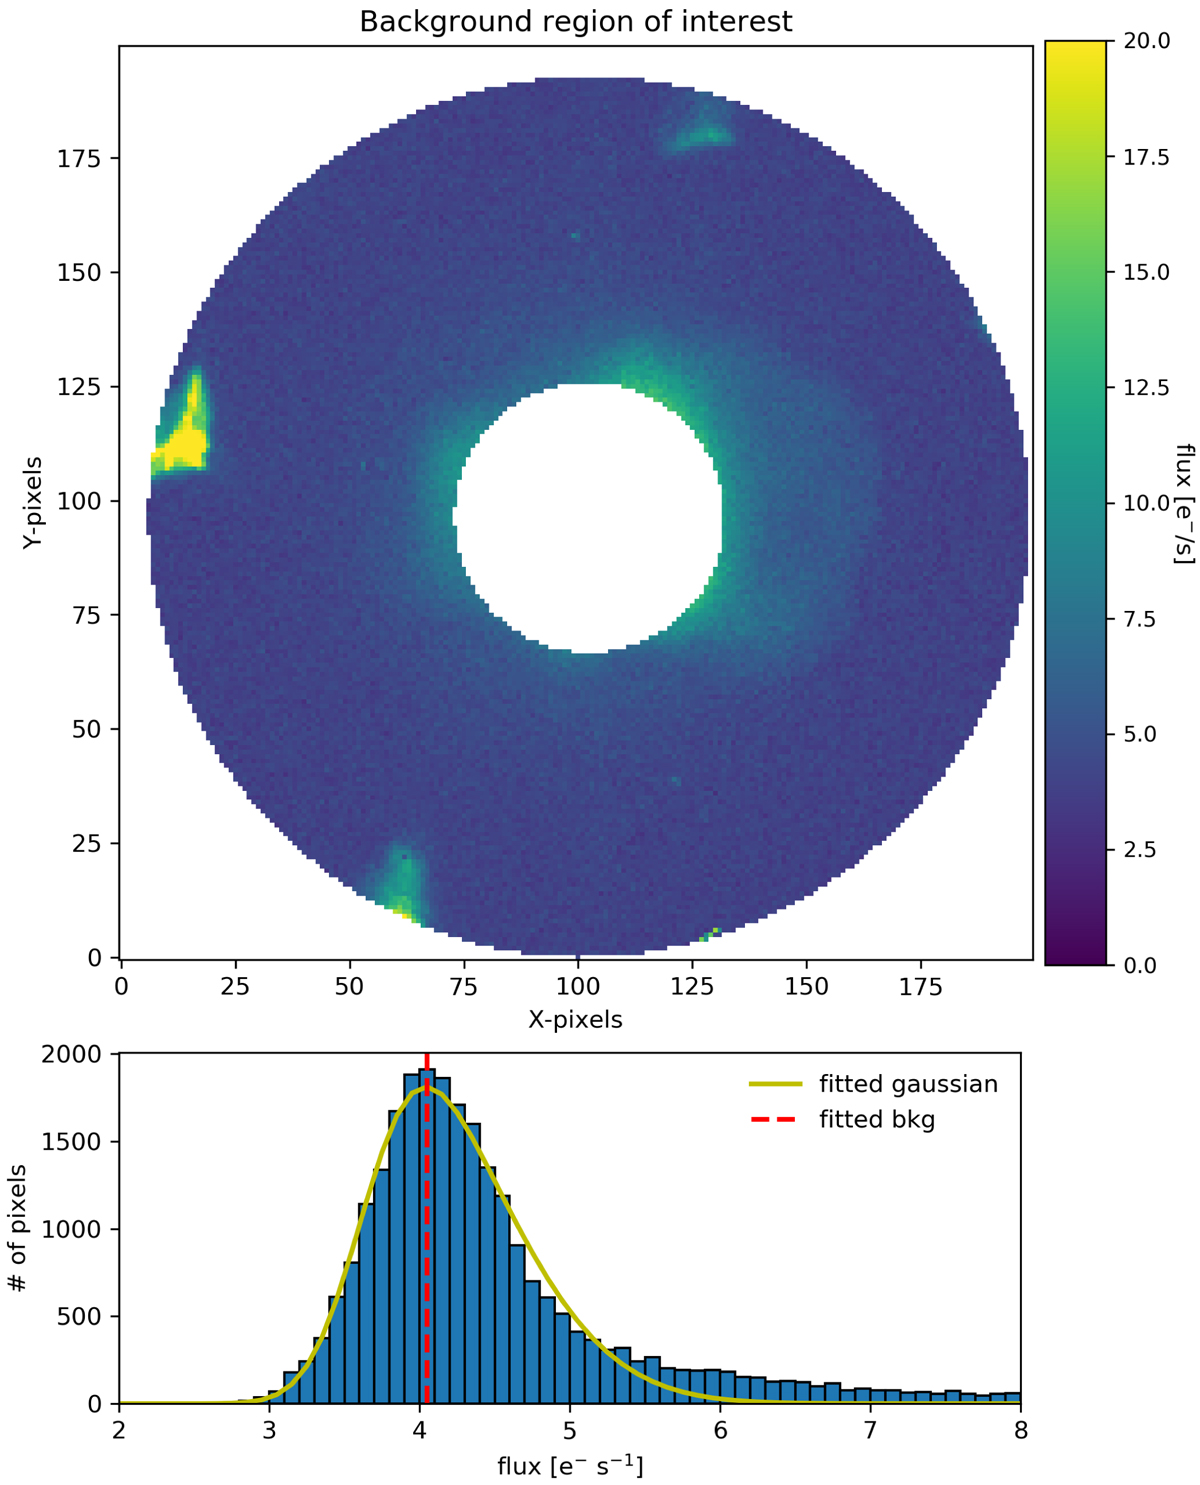
Background estimation from one image. Top: masked region excluding the target. Bottom: histogram of the pixels in the background region after clipping extreme values shown together with the fit Gaussian function (orange) and the adopted background level (red dashed vertical line).
Current usage metrics show cumulative count of Article Views (full-text article views including HTML views, PDF and ePub downloads, according to the available data) and Abstracts Views on Vision4Press platform.
Data correspond to usage on the plateform after 2015. The current usage metrics is available 48-96 hours after online publication and is updated daily on week days.
Initial download of the metrics may take a while.