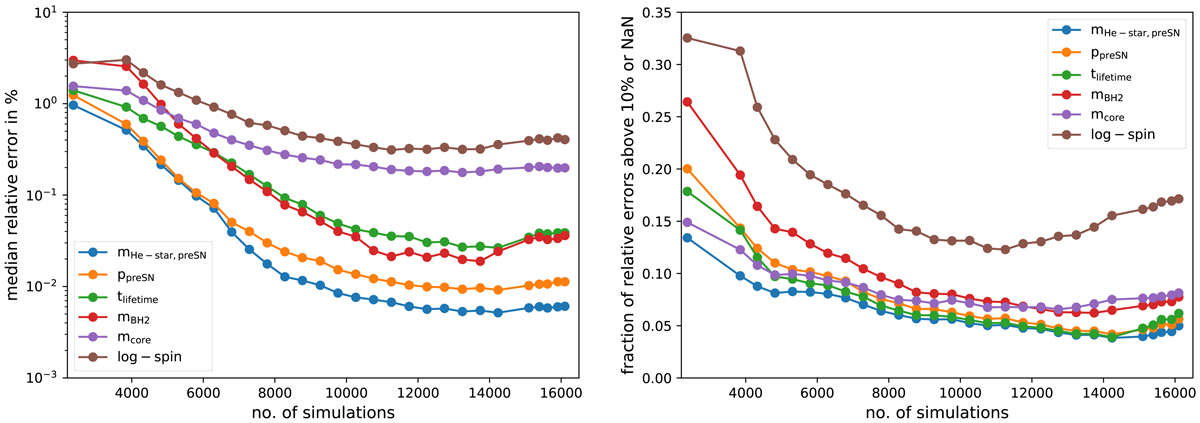
Fig. C.1.

Median relative error of the interpolation expressed as a percentage (left) and the fraction of relative errors above 10% (right) from all iterations of the 50 leave 5% of the sample out tests for six interpolated quantities. The points on each plot, moving from left to right, represent the different iterations; we exclude all simulations that stopped due to initial Roche-lobe overflow (indicating a difference between COMPAS and MESA models). The right plot includes NaNs (obtained from non-fittable points, e.g., points at the boundary of the parameter space) when counting relative errors larger than 10%, while the left plot excludes them.
Current usage metrics show cumulative count of Article Views (full-text article views including HTML views, PDF and ePub downloads, according to the available data) and Abstracts Views on Vision4Press platform.
Data correspond to usage on the plateform after 2015. The current usage metrics is available 48-96 hours after online publication and is updated daily on week days.
Initial download of the metrics may take a while.


