Fig. 4.
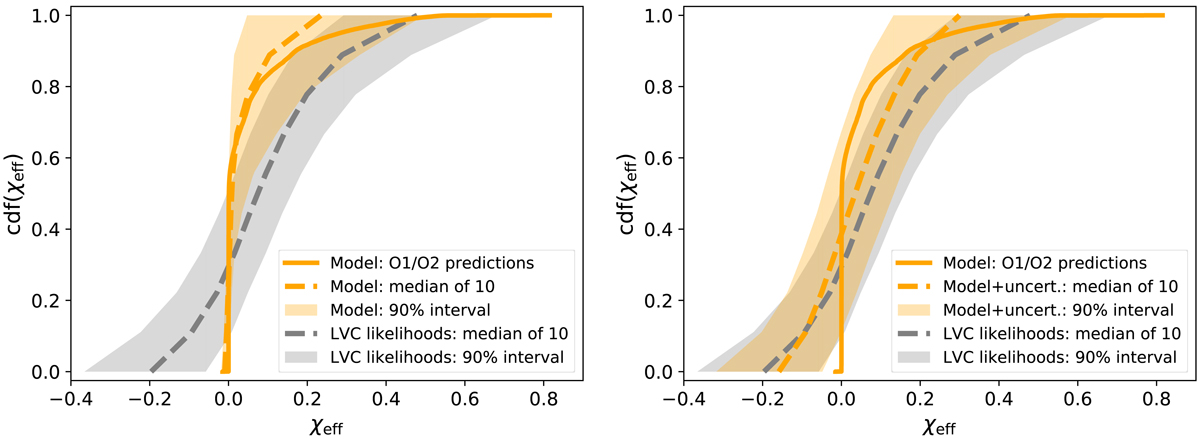
Cumulative distribution functions (cdfs) of the effective inspiral spin parameter χeff as predicted for O1/O2 by our model (solid orange line). Left: from our model we generate 5000 sets of 10 measurements and plot the median cdf (dashed orange line) together with the 90% credible interval (shaded orange region). Right: we generate again 5000 sets of 10 measurements from our model to which we now add mock measurement uncertainties generated from the zero-centered LVC data likelihoods. We plot the median cdf (dashed orange line) and the 90% credible interval (shaded orange region). For both graphs, in gray, we plot the median cdf (dashed line) and the 90% credible interval (shaded region) of 5000 samples from the 10 actual observations generated from their respective LVC data likelihoods.
Current usage metrics show cumulative count of Article Views (full-text article views including HTML views, PDF and ePub downloads, according to the available data) and Abstracts Views on Vision4Press platform.
Data correspond to usage on the plateform after 2015. The current usage metrics is available 48-96 hours after online publication and is updated daily on week days.
Initial download of the metrics may take a while.