Fig. 3.
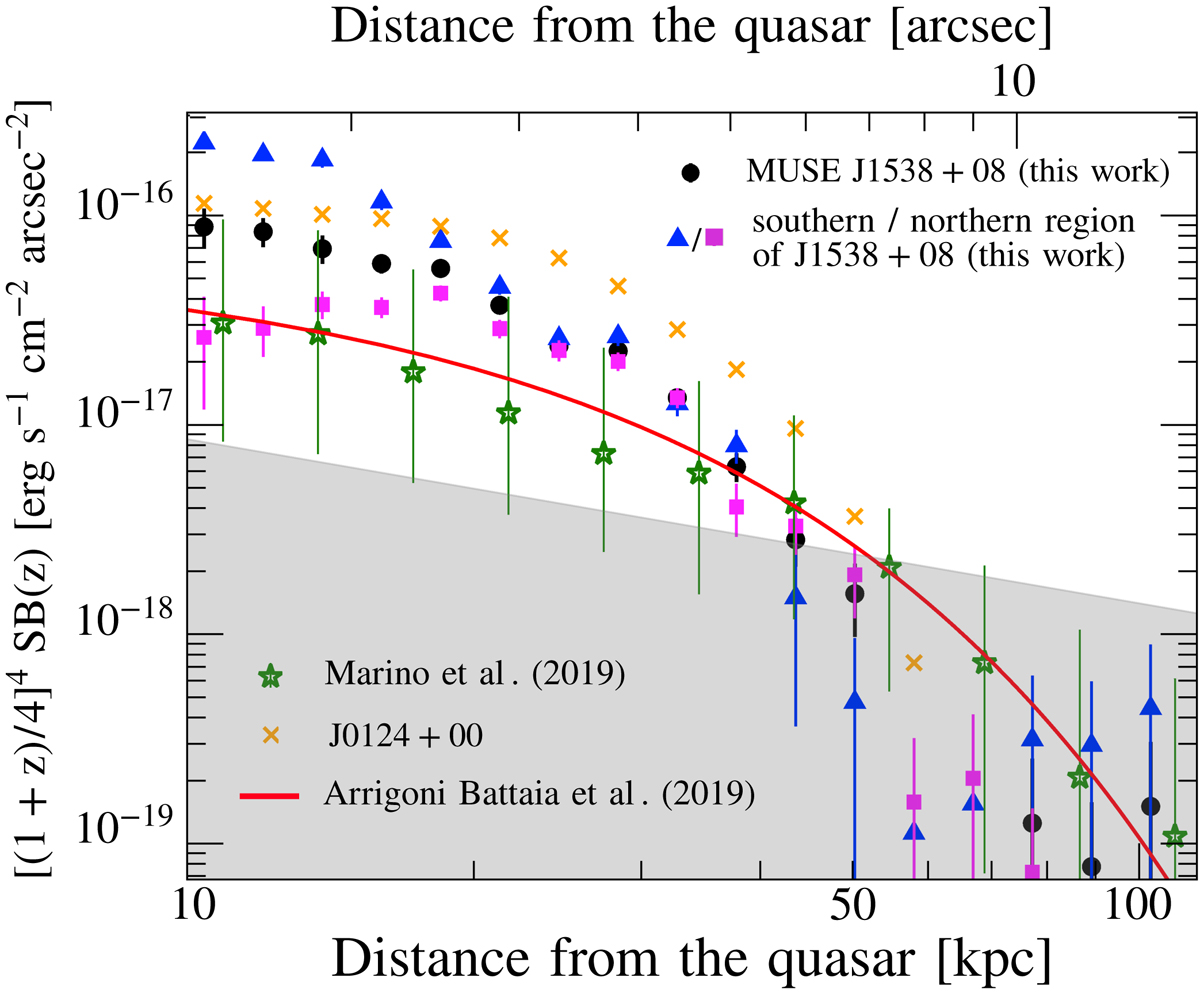
Lyα SB radial profile (black circles) of the pseudo-NB image. The points represent bins of SB measured in concentric annuli centred on the quasar position and their errors indicate the 16th and 84th percentile, which corresponds to ∼68% of the SB distribution centred on the median value (i.e. ±1σ for a Gaussian distribution). The bin width is chosen to be uniformly spaced in a logarithmic scale. The blue triangles and magenta squares show the radial profiles measured in the southern and northern region of the CEN, respectively (see Fig. 1). The red curve is the modelled average radial profile of the AB19 quasar sample. We also include the average radial profile of the Lyα-CEN of the sample of B16, which was recalculated by Marino et al. (2019) (the error bars represent the 25th and 75th percentiles). The orange crosses represent the radial profile of the Lyα-CEN around the WISSH quasar J0124+00 in the B16 sample. All the SB profiles were corrected for the cosmological dimming effect and re-scaled at z = 3 (i.e. [(1 + z)/4]4 × SB(z)). The grey shaded area indicates the 2σ Poisson noise relative to the rescaled profiles of the Lyα-CEN around J1538+08 (see Sect. 4.1 for details). We verified that the decline of the SB radial profile from the northern region (magenta squares) at short radius towards the centre is not due to the white region immediately north of the quasar (see Fig. 1).
Current usage metrics show cumulative count of Article Views (full-text article views including HTML views, PDF and ePub downloads, according to the available data) and Abstracts Views on Vision4Press platform.
Data correspond to usage on the plateform after 2015. The current usage metrics is available 48-96 hours after online publication and is updated daily on week days.
Initial download of the metrics may take a while.