Fig. B.1.
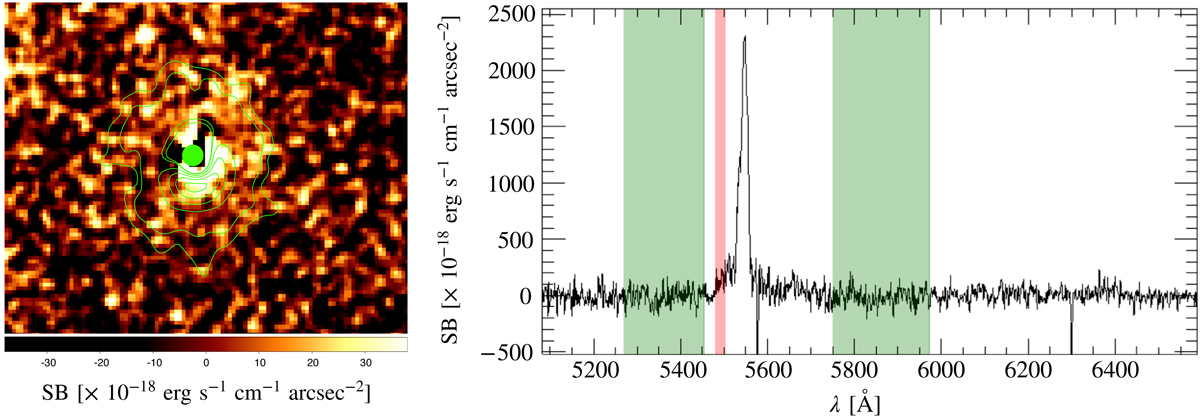
Left panel: pseudo-NB image obtained by collapsing the spectral region of the blue tail (see red area in the right panel) and by subtracting the continuum estimated in spectral regions without line features (see green areas in the right panel). Right panel: spectrum that is extracted from the PSF- and continuum-subtracted datacube by only selecting the spaxels that belong to the CEN with S/N > 5. The red and green areas mark the spectral region that is collapsed and subtracted, respectively, to obtain the pseudo-NB in the left panel.
Current usage metrics show cumulative count of Article Views (full-text article views including HTML views, PDF and ePub downloads, according to the available data) and Abstracts Views on Vision4Press platform.
Data correspond to usage on the plateform after 2015. The current usage metrics is available 48-96 hours after online publication and is updated daily on week days.
Initial download of the metrics may take a while.