Fig. 1.
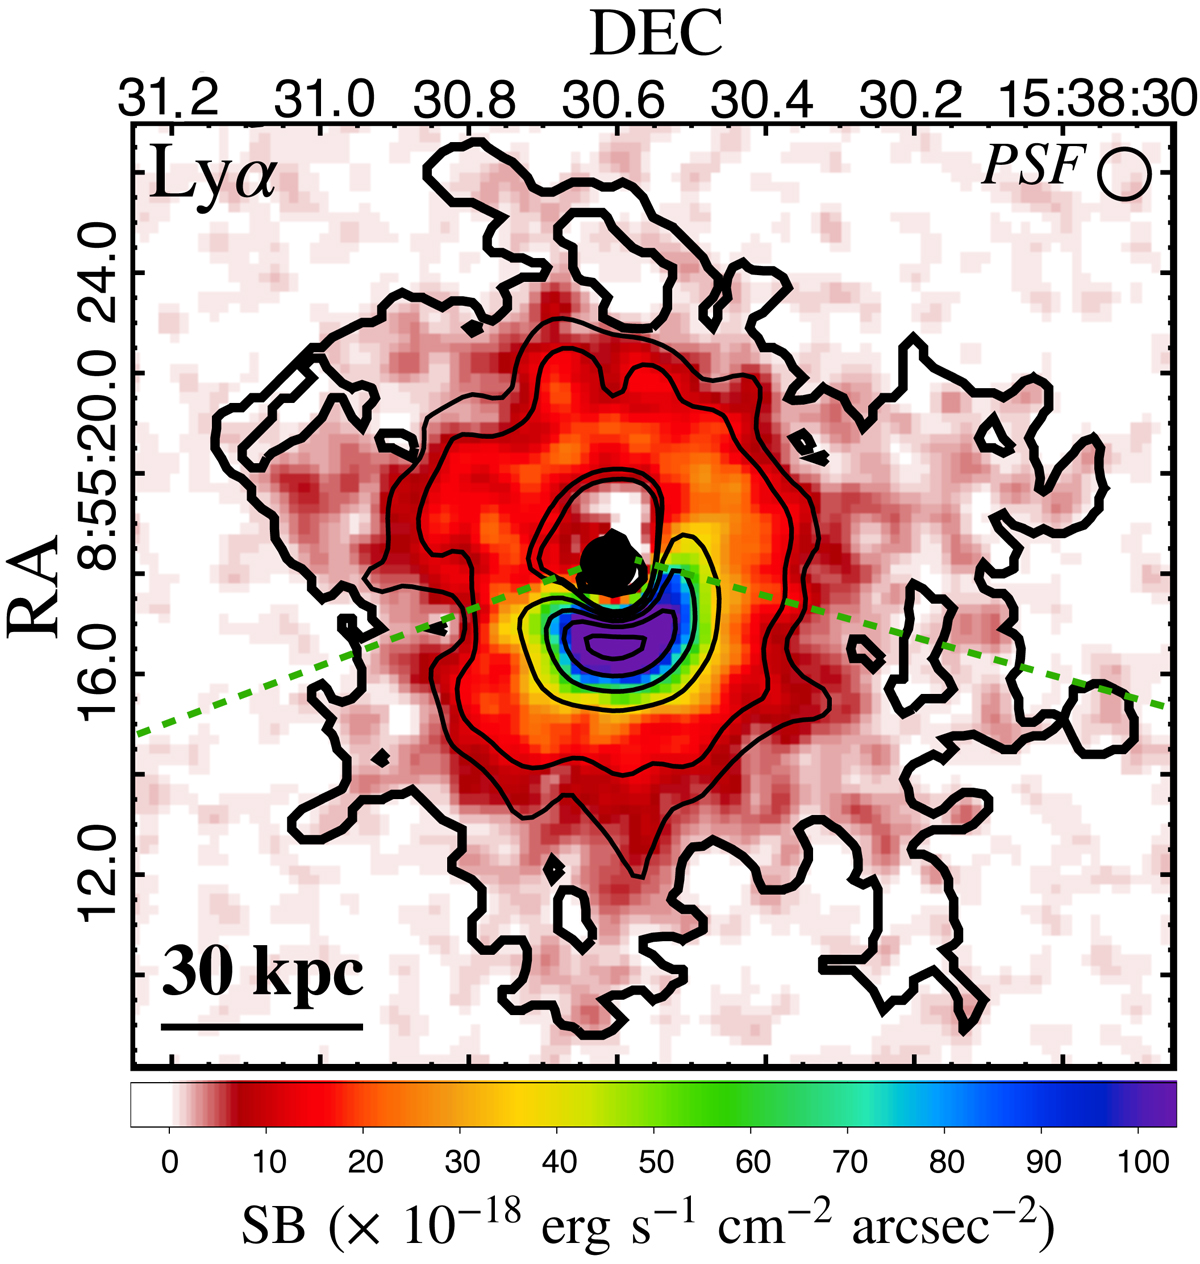
Optimally extracted SB map of the Lyα-CEN. The quasar position is marked by a black dot. The thick black contour corresponds to the two-dimensional projection of the boundary of the CEN from the 3D-mask. It indicates an SB level of about 10−18 erg s−1 cm−2 arcsec−2. The thin black contours indicate the S/N levels 3, 5, 15, 25, 35, and 45 extracted from the S/N map. The wavelength layer at the Lyα profile peak is used to report the background fluctuations in the image. On the top-right corner, the circle indicates the size of the FWHM of the instrument PSF. The green dashed lines delimit two regions of the Lyα-CEN (i.e. north and south from the quasar position) used for the extraction of the radial profile (see Fig. 3). The low-S/N region close to the quasar with SB values around zero could be the result of either random fluctuations or real features of the distribution of the CGM gas emission.
Current usage metrics show cumulative count of Article Views (full-text article views including HTML views, PDF and ePub downloads, according to the available data) and Abstracts Views on Vision4Press platform.
Data correspond to usage on the plateform after 2015. The current usage metrics is available 48-96 hours after online publication and is updated daily on week days.
Initial download of the metrics may take a while.