Fig. 2
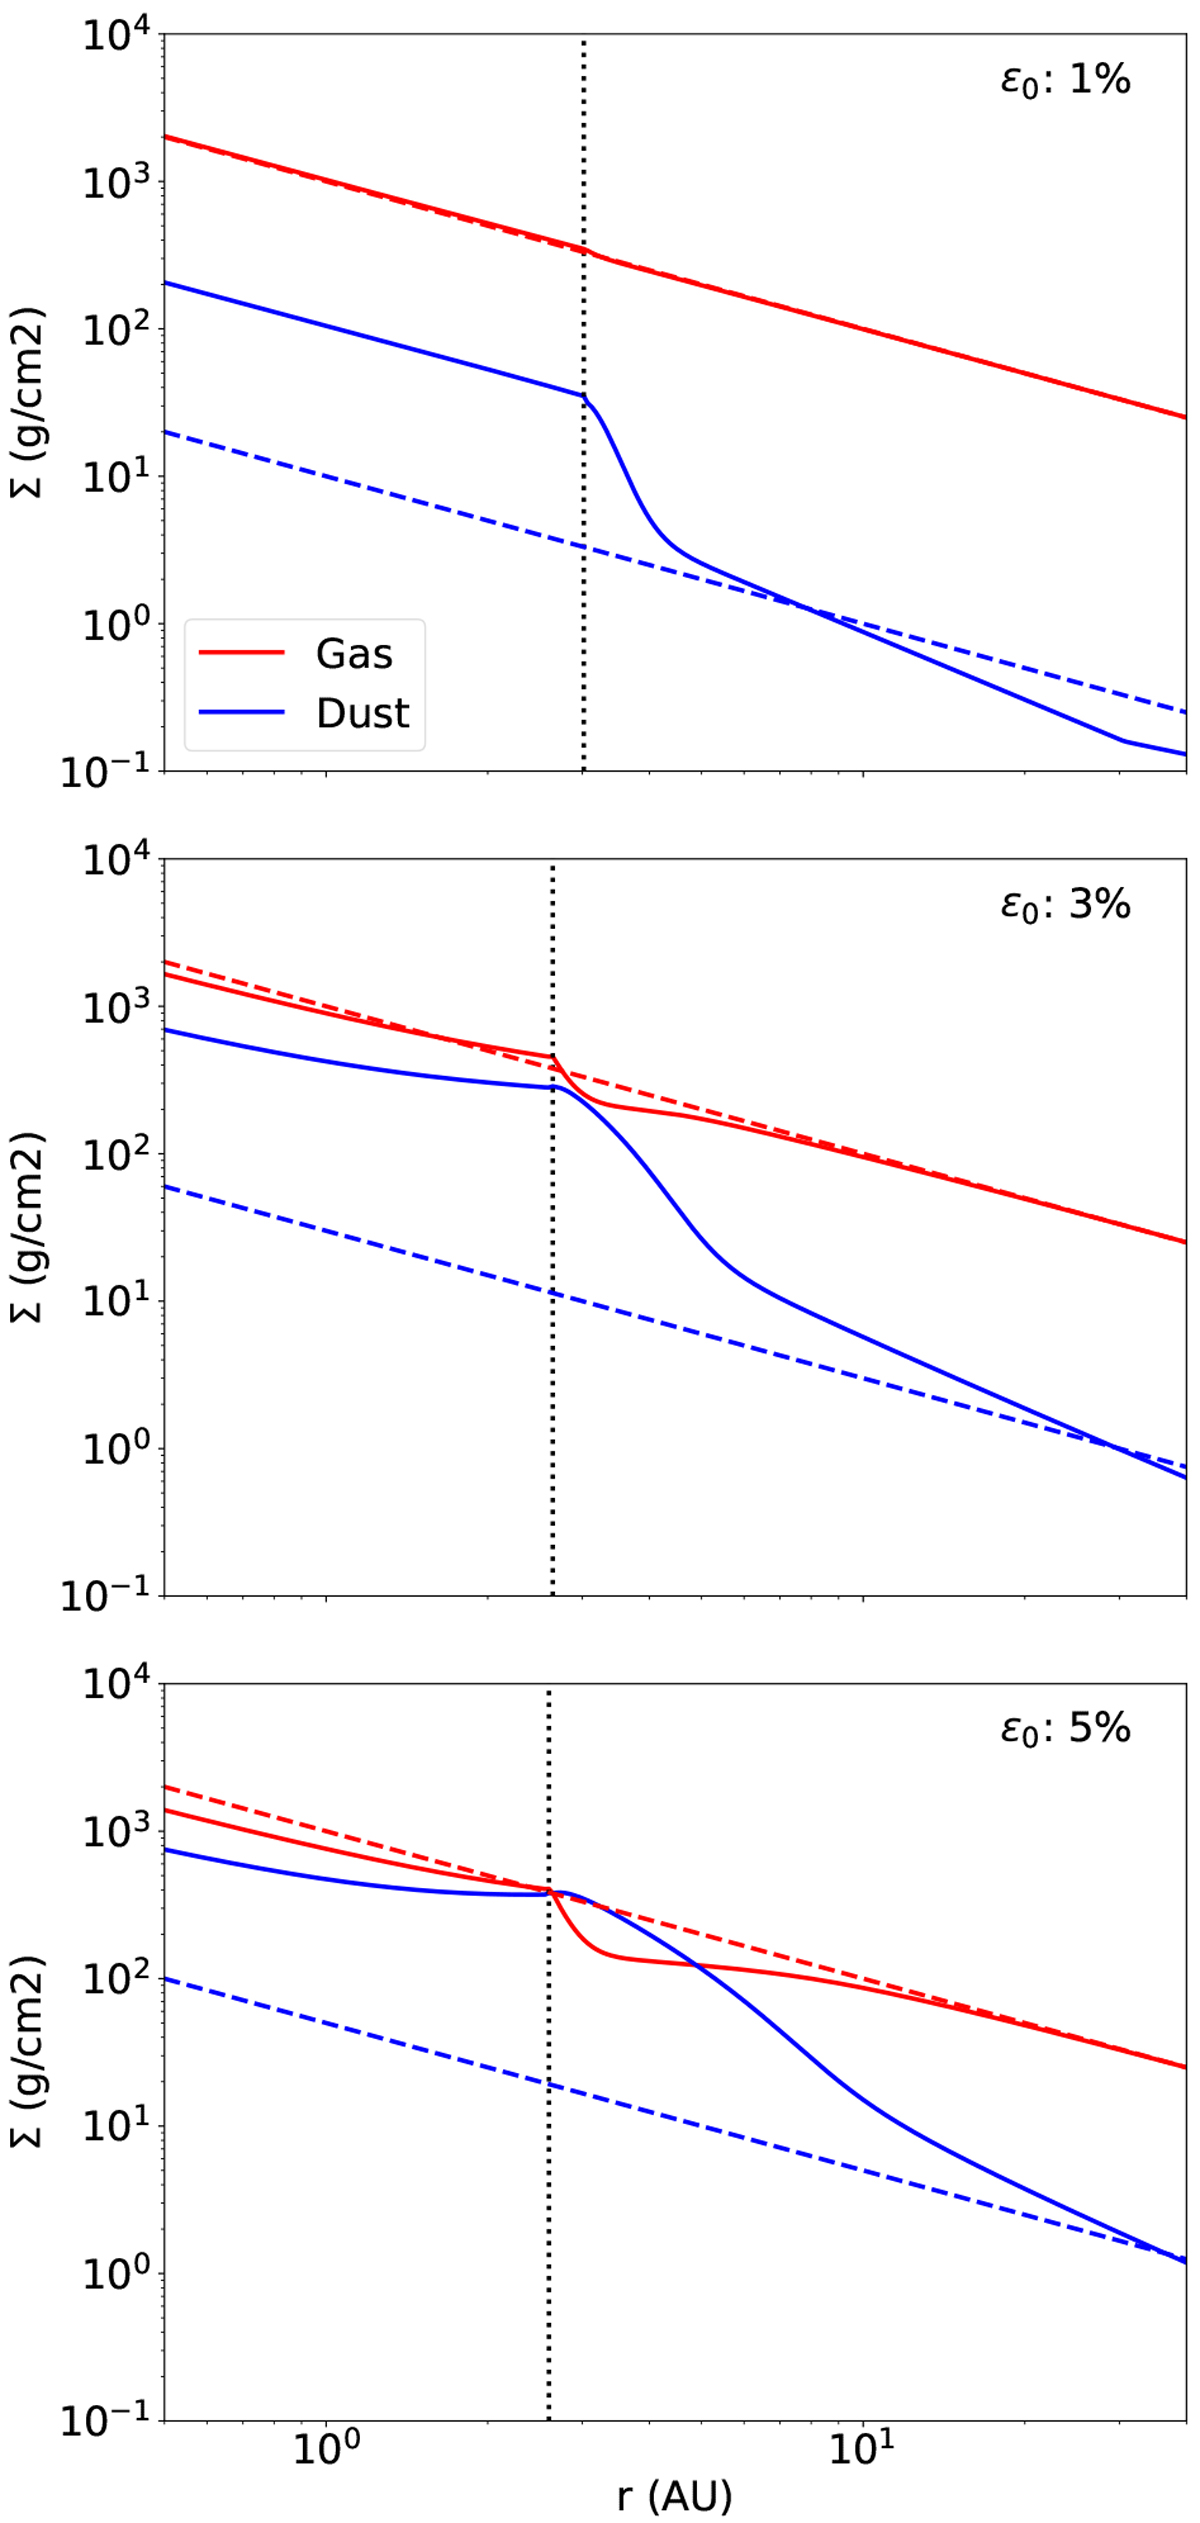
Surface density radial profiles of gas (red) and dust (blue) around the snow line. The dashed lines mark the initial conditions, and solid lines mark the simulation after 0.4 Myr. The dotted line marks the snow line at 0.4 Myr. Top, middle, and bottom panels: correspond to the cases with “Low”, ‘̀Mid”, and “High ” ε0, respectively.
Current usage metrics show cumulative count of Article Views (full-text article views including HTML views, PDF and ePub downloads, according to the available data) and Abstracts Views on Vision4Press platform.
Data correspond to usage on the plateform after 2015. The current usage metrics is available 48-96 hours after online publication and is updated daily on week days.
Initial download of the metrics may take a while.