Open Access
Fig. C.2
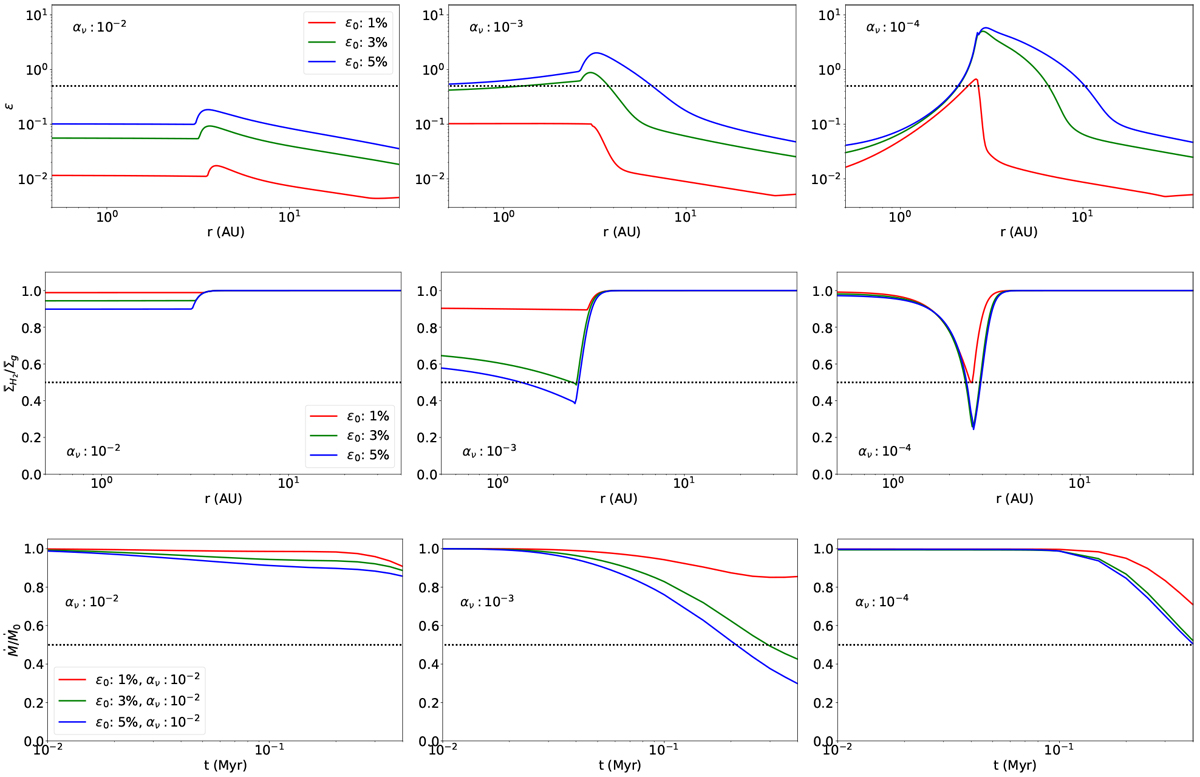
Top row: dust-to-gas ratio radial profile. Middle row: H2, He mass fraction radial profile. Bottom row: accretion rate time evolution (divided by the initial steady state accretion Ṁ0). All for different values of ε0 and αν. The value of 0.5 is marked with a dotted line in every plot.
Current usage metrics show cumulative count of Article Views (full-text article views including HTML views, PDF and ePub downloads, according to the available data) and Abstracts Views on Vision4Press platform.
Data correspond to usage on the plateform after 2015. The current usage metrics is available 48-96 hours after online publication and is updated daily on week days.
Initial download of the metrics may take a while.