Fig. 11
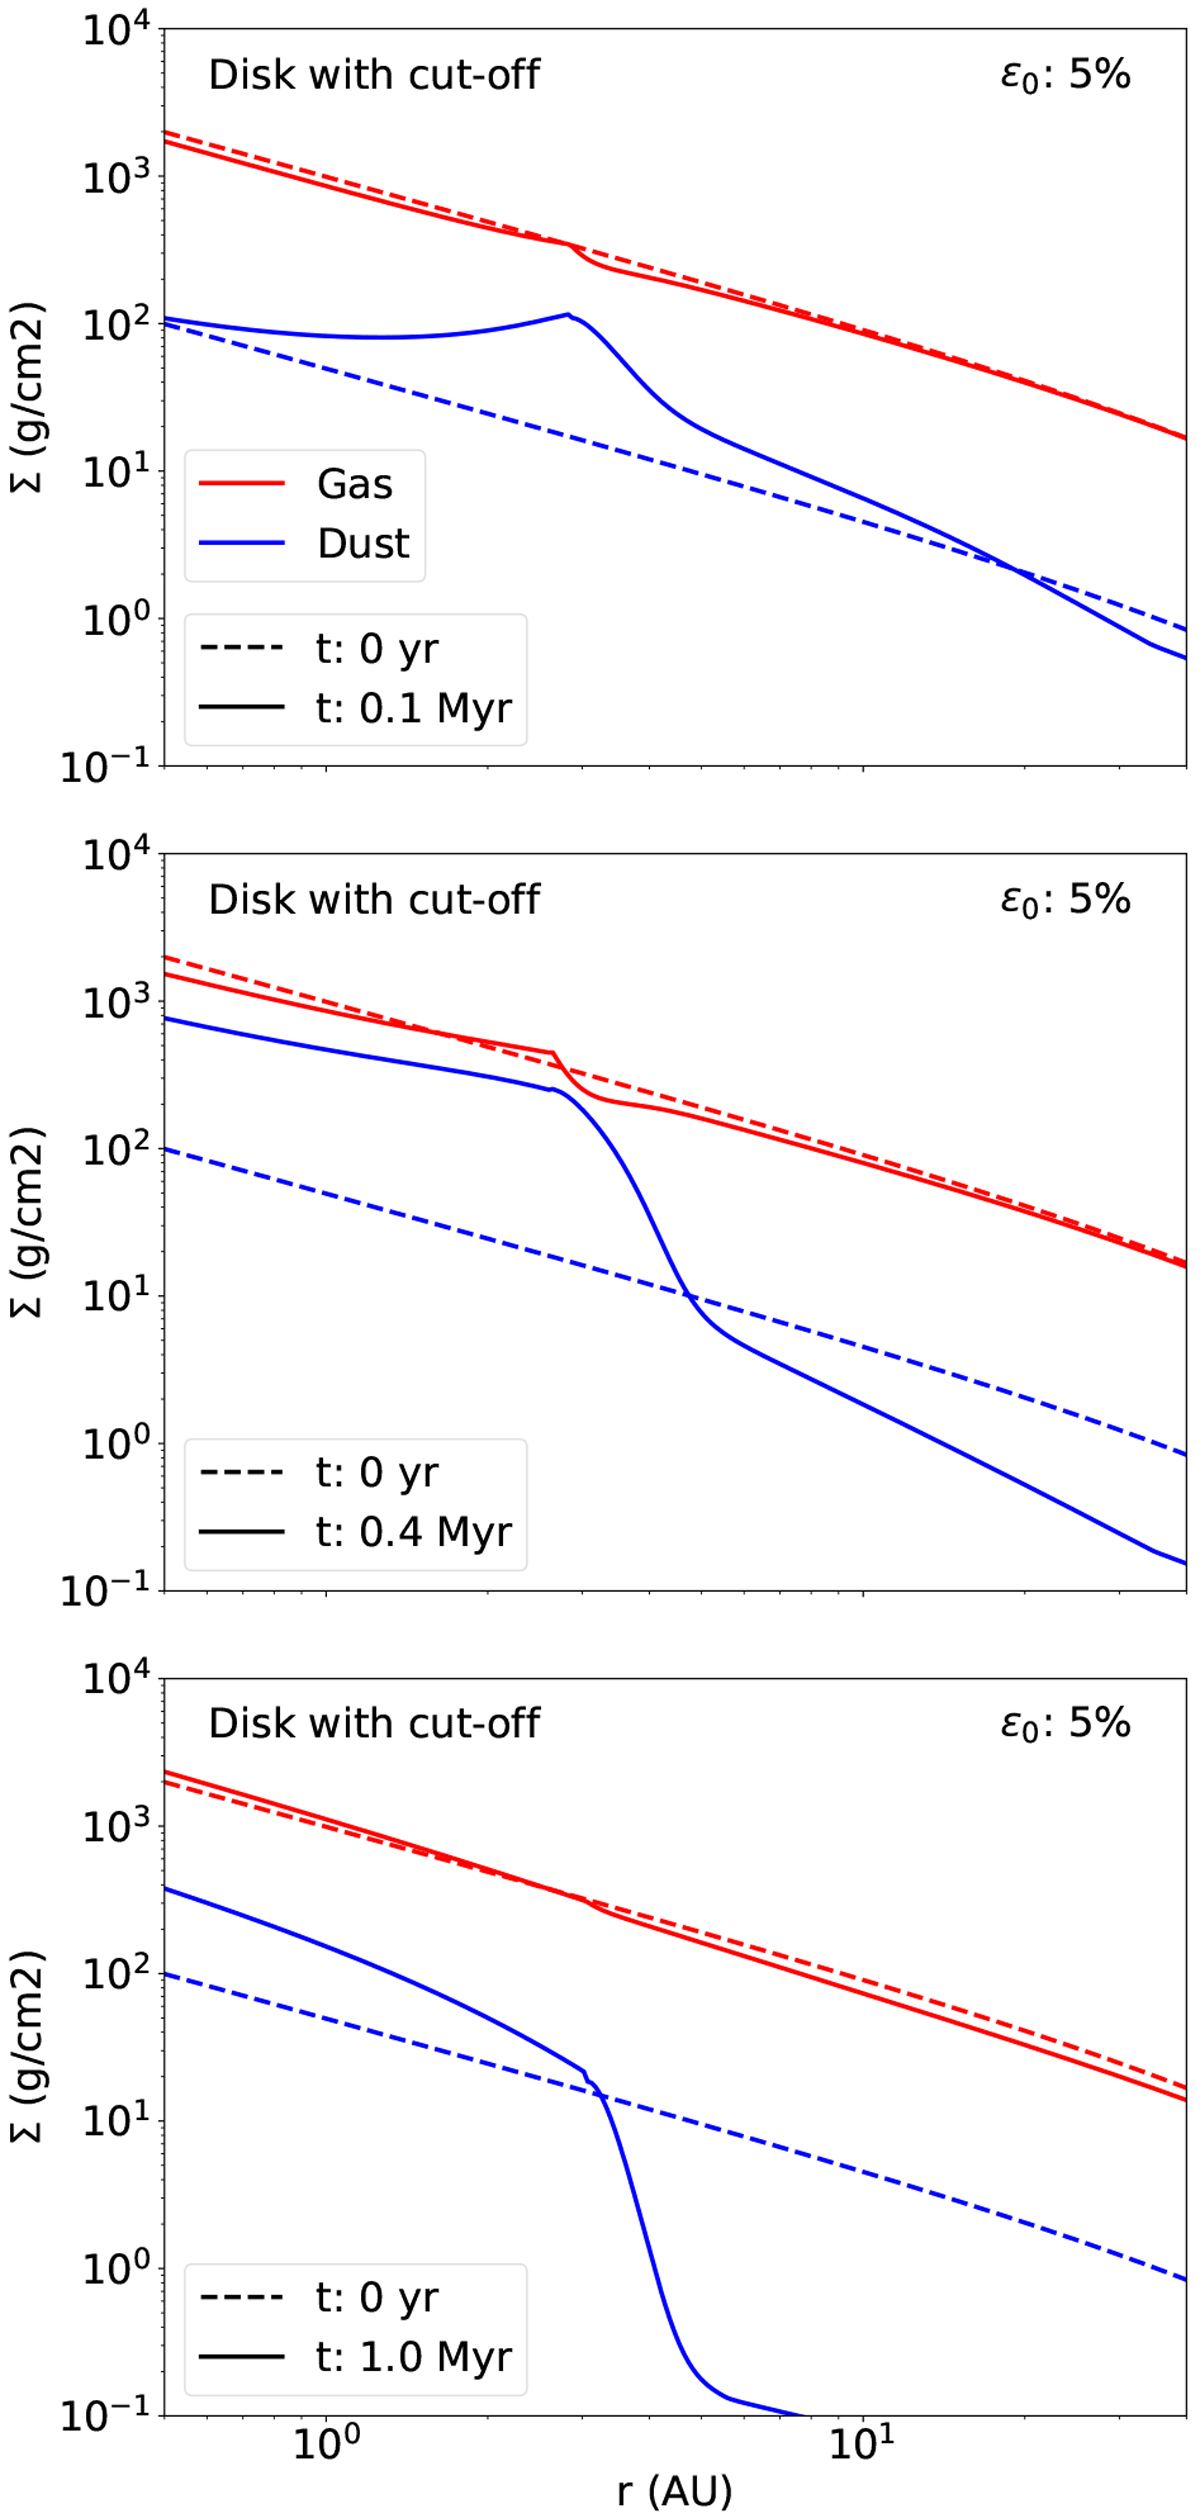
Surface density profiles of gas (red) and dust (blue) at different times (solid lines). The initial condition corresponds to the self-similar profile (dashed lines). Top: simulation initially behaves in the same way as the power law profile until 0.1 Myr. Mid: at 0.4 Myr the dust supply gets exhausted before the back-reaction push can further deplete the gaseous disk. Bottom: after 1 Myr, the gas profile looks very similar to its initial condition, but most of the dust has been accreted.
Current usage metrics show cumulative count of Article Views (full-text article views including HTML views, PDF and ePub downloads, according to the available data) and Abstracts Views on Vision4Press platform.
Data correspond to usage on the plateform after 2015. The current usage metrics is available 48-96 hours after online publication and is updated daily on week days.
Initial download of the metrics may take a while.