Fig. 7.
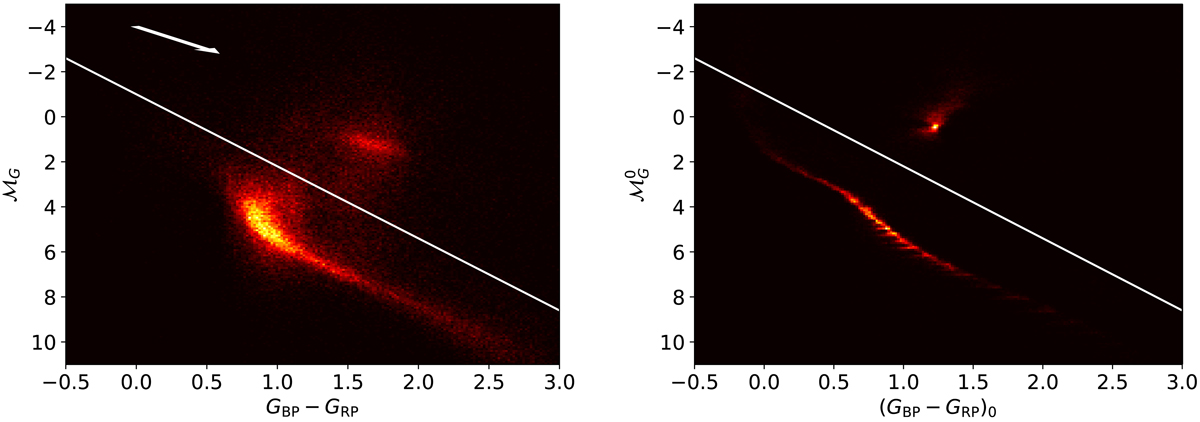
Absolute magnitude vs. colour diagram for GES iDR5 stars using Gaia DR2 parallaxes and photometry without (left) and with (right) correction for extinction and reddening taken from Andrae et al. (2018). We included all sources irrespective of their parallax and flux uncertainties. Almost 40% of the stars in the left diagram have a Gaia DR2 extinction and colour excess values. The white line marks the separation between dwarfs and giants using Eq. (14). The white arrow in the left panel represents the reddening vector.
Current usage metrics show cumulative count of Article Views (full-text article views including HTML views, PDF and ePub downloads, according to the available data) and Abstracts Views on Vision4Press platform.
Data correspond to usage on the plateform after 2015. The current usage metrics is available 48-96 hours after online publication and is updated daily on week days.
Initial download of the metrics may take a while.