Fig. 6.
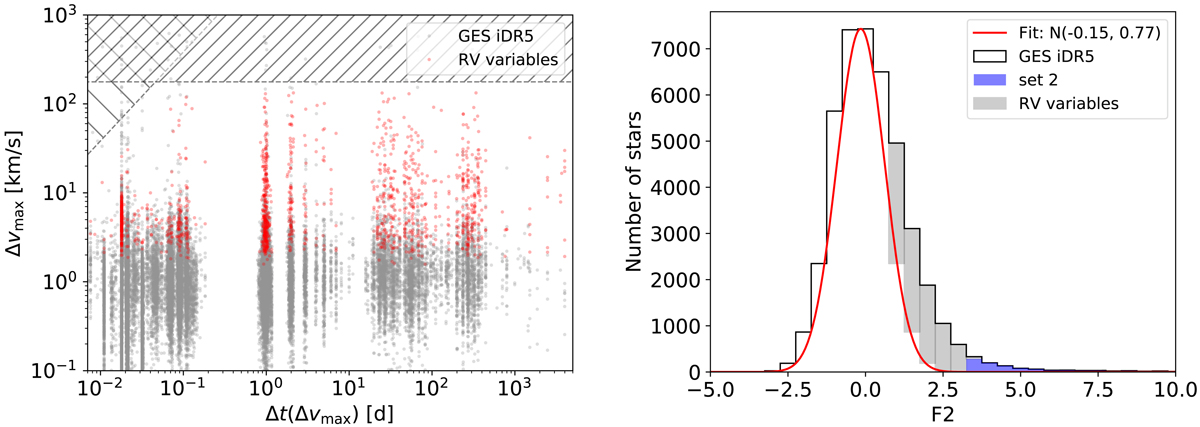
Left: RV range per star as a function of the time difference between the RV measurements for GES iDR5 (grey dots) and for RV variables of set 1 (red dots). The horizontal and inclined hatched areas excluded stars showing Δvmax larger than 177 km s−1, and stars showing (Δv/Δt)max > 160 km s−1 h−1. Right: F2 distribution of GES iDR5 stars (empty histogram), RV variables (filled grey) and set 2 (filled blue). The red line is the fit of the total GES iDR5 histogram.
Current usage metrics show cumulative count of Article Views (full-text article views including HTML views, PDF and ePub downloads, according to the available data) and Abstracts Views on Vision4Press platform.
Data correspond to usage on the plateform after 2015. The current usage metrics is available 48-96 hours after online publication and is updated daily on week days.
Initial download of the metrics may take a while.