Fig. 22.
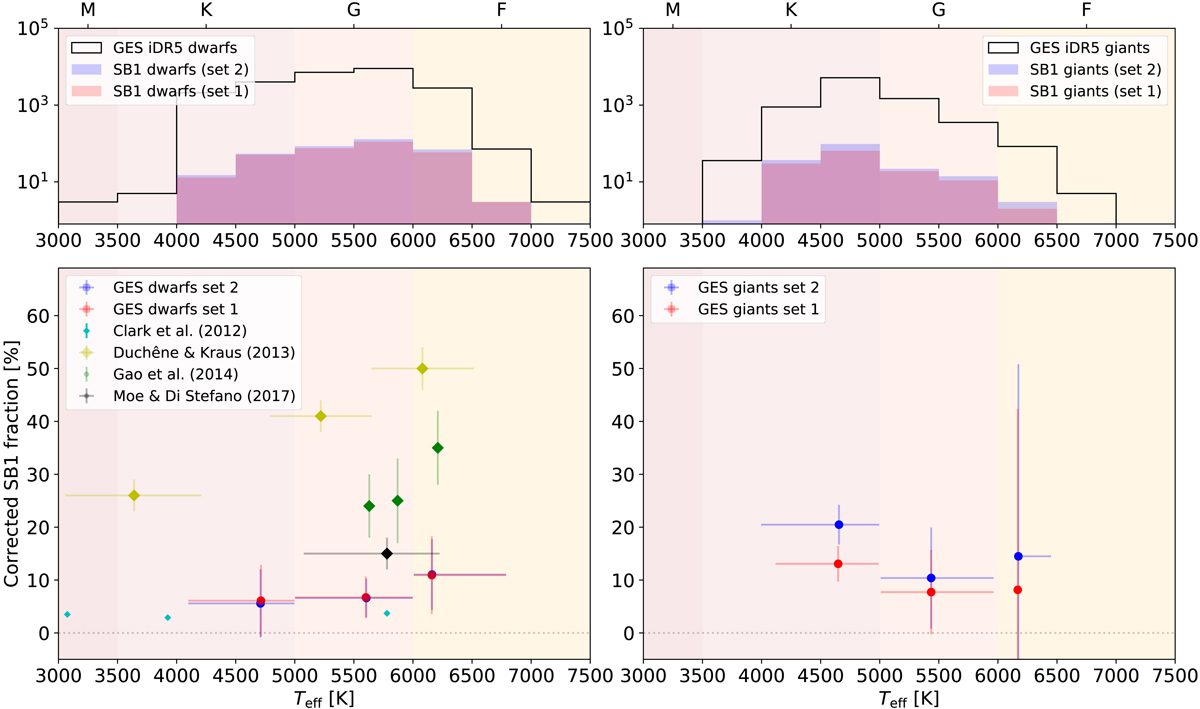
Top panels: effective-temperature histograms for GES iDR5 stars (solid line), and SB1 candidates from sets 1 (red) and 2 (blue). Left panels: main sequence stars and right panels: giant stars. Bottom panels: corrected SB1 fractions as a function of Teff for SB1 candidates from sets 1 and 2 (red and blue dots, respectively). The dots are centred on the median Teff in each spectral type and the Teff range in each spectral type is illustrated by the horizontal error bars. Yellow data points from Duchêne & Kraus (2013) correspond to the total binary rather than the SB1 fraction which is limited to shorter orbital periods (see text for details) and are not directly comparable with other datasets.
Current usage metrics show cumulative count of Article Views (full-text article views including HTML views, PDF and ePub downloads, according to the available data) and Abstracts Views on Vision4Press platform.
Data correspond to usage on the plateform after 2015. The current usage metrics is available 48-96 hours after online publication and is updated daily on week days.
Initial download of the metrics may take a while.