Fig. 12.
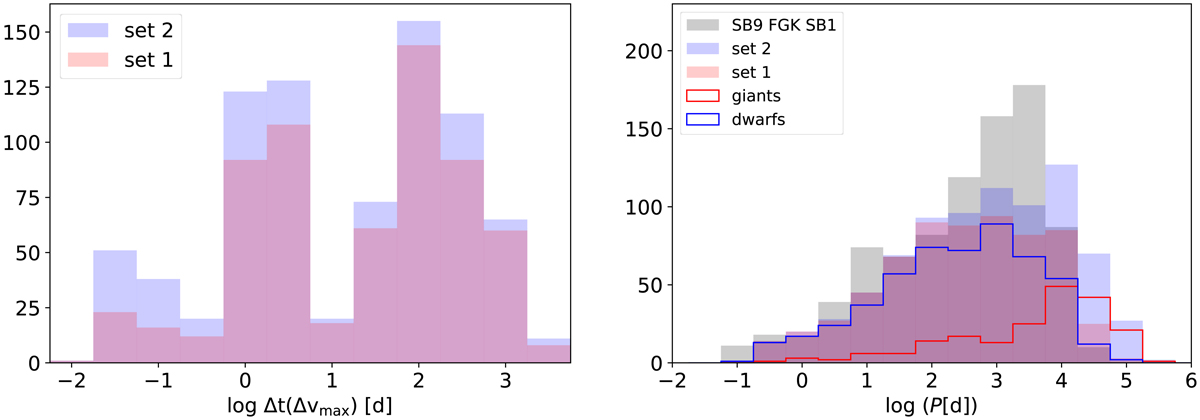
Left: distribution of the time sampling corresponding to the maximum RV differences (RV range) for SB1 candidates of the sets 1 (red) and 2 (blue). Right: distribution of the SB1 orbital periods assuming that the amplitude K of the RV curve may be derived from Eq. (16) for sets 1 and 2 (red and blue filled histograms) and for SB1 dwarfs and giants (from set 2, blue and red empty histograms). The distribution of FGK-type SB1s from the SB9 catalogue (Pourbaix et al. 2004) is overplotted in grey.
Current usage metrics show cumulative count of Article Views (full-text article views including HTML views, PDF and ePub downloads, according to the available data) and Abstracts Views on Vision4Press platform.
Data correspond to usage on the plateform after 2015. The current usage metrics is available 48-96 hours after online publication and is updated daily on week days.
Initial download of the metrics may take a while.