Free Access
Fig. 11.
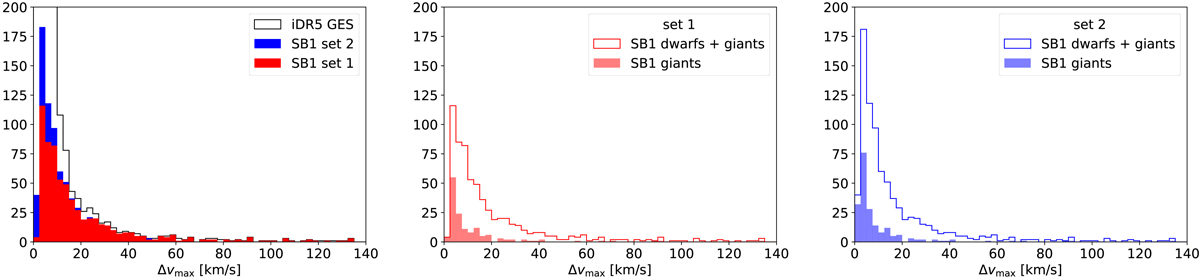
Left: RV range histograms for the analysed GES iDR5 sample (white) and for SB1 candidates at ∼5σ (red, set 1) and at ∼3σ (blue, set 2). Middle: corresponding histograms for SB1 set 1 separately for giants (filled red) and dwarfs+giants (red line). Right: same as middle panel but for set 2.
Current usage metrics show cumulative count of Article Views (full-text article views including HTML views, PDF and ePub downloads, according to the available data) and Abstracts Views on Vision4Press platform.
Data correspond to usage on the plateform after 2015. The current usage metrics is available 48-96 hours after online publication and is updated daily on week days.
Initial download of the metrics may take a while.