Fig. 1.
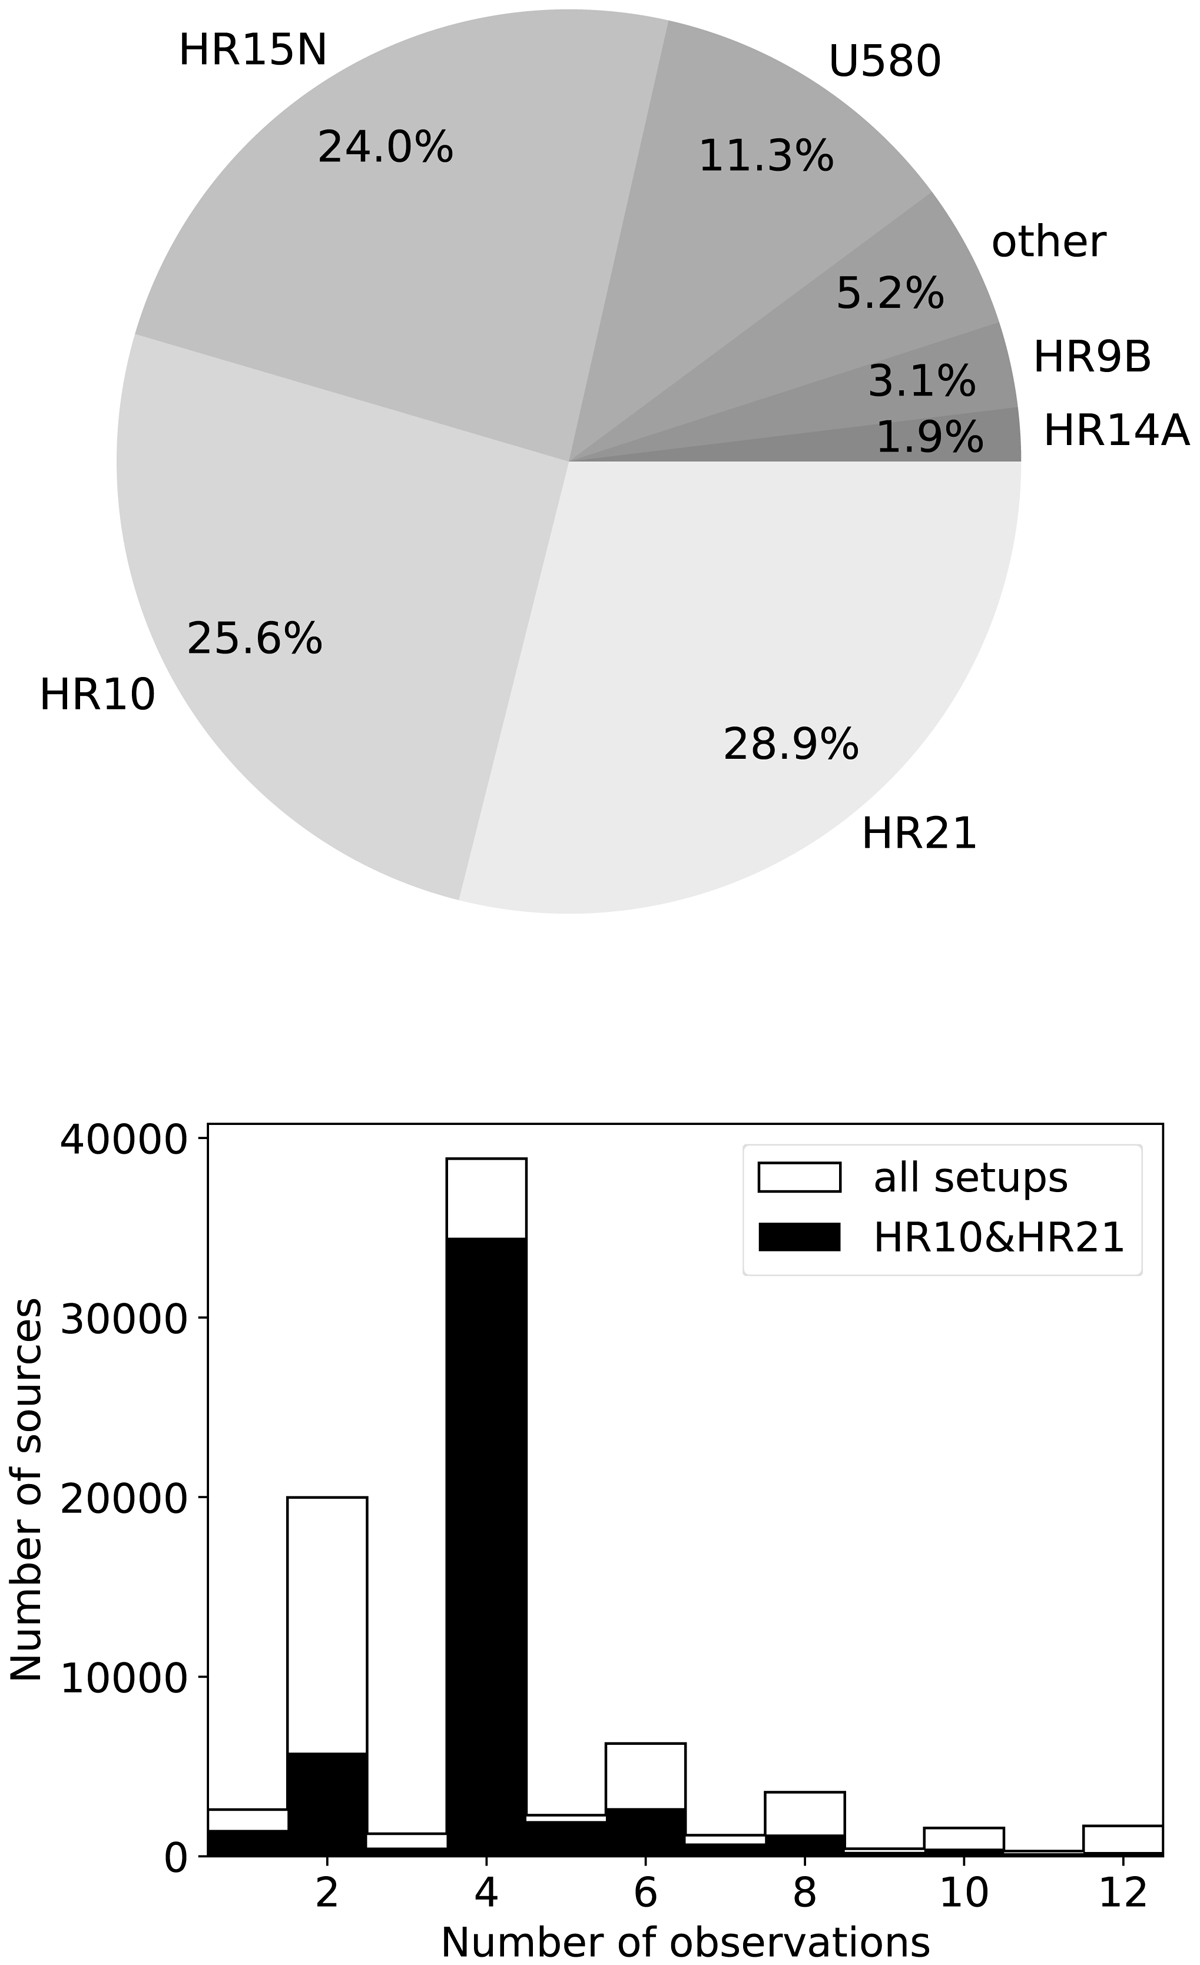
Top panel: Pie chart of single GES iDR5 exposures per instrumental setup. The part labelled “other” contains GIRAFFE setups HR3, HR5A, HR6, and HR15, as well as the U520 UVES setup. Bottom panel: distribution of sources per number of observations (single exposures) within GES iDR5. Even numbers are favoured because sources are generally observed in both HR10 and HR21. In the case of four observations, we generally have two consecutive observations in HR10 and in HR21, both close in time.
Current usage metrics show cumulative count of Article Views (full-text article views including HTML views, PDF and ePub downloads, according to the available data) and Abstracts Views on Vision4Press platform.
Data correspond to usage on the plateform after 2015. The current usage metrics is available 48-96 hours after online publication and is updated daily on week days.
Initial download of the metrics may take a while.