Fig. 9
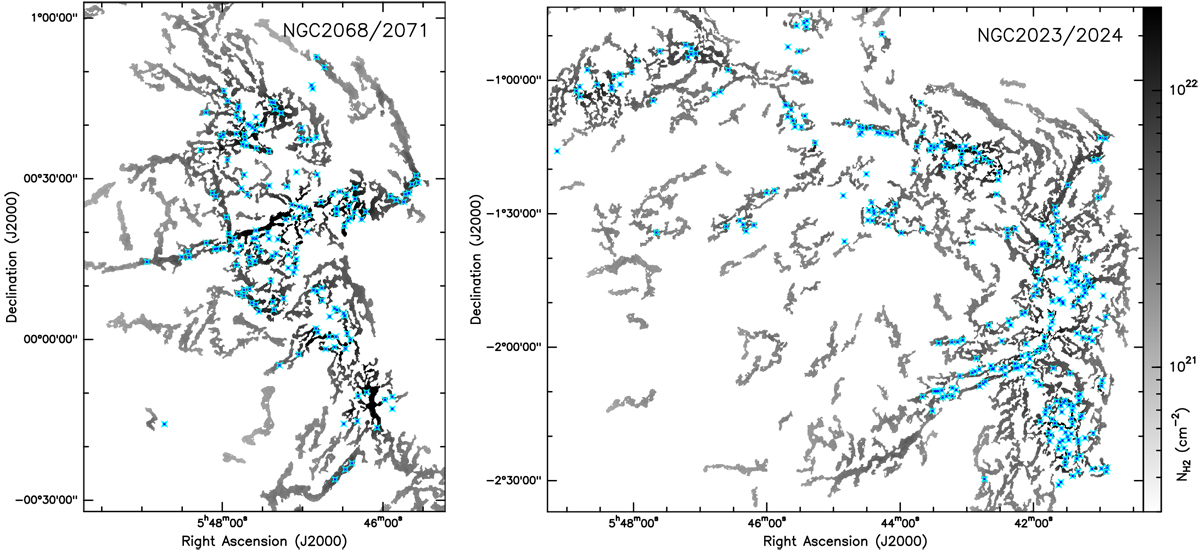
Spatial distributions of robust prestellar cores (blue symbols) overplotted on the filament networks (gray background images) traced with getfilaments in NGC 2068 and 2071 (left), and NGC 2023 and 2024 (right). Transverse angular scales up to 100′′ across the filament footprints are shown here, corresponding to ~0.2 pc at d = 400 pc. In both panels, the color scale displayed within the filament mask corresponds to column density values in the original column density map (Fig. 2 left). See Fig. E.2 (right) for a similar view in the case of L1622.
Current usage metrics show cumulative count of Article Views (full-text article views including HTML views, PDF and ePub downloads, according to the available data) and Abstracts Views on Vision4Press platform.
Data correspond to usage on the plateform after 2015. The current usage metrics is available 48-96 hours after online publication and is updated daily on week days.
Initial download of the metrics may take a while.