Fig. 5
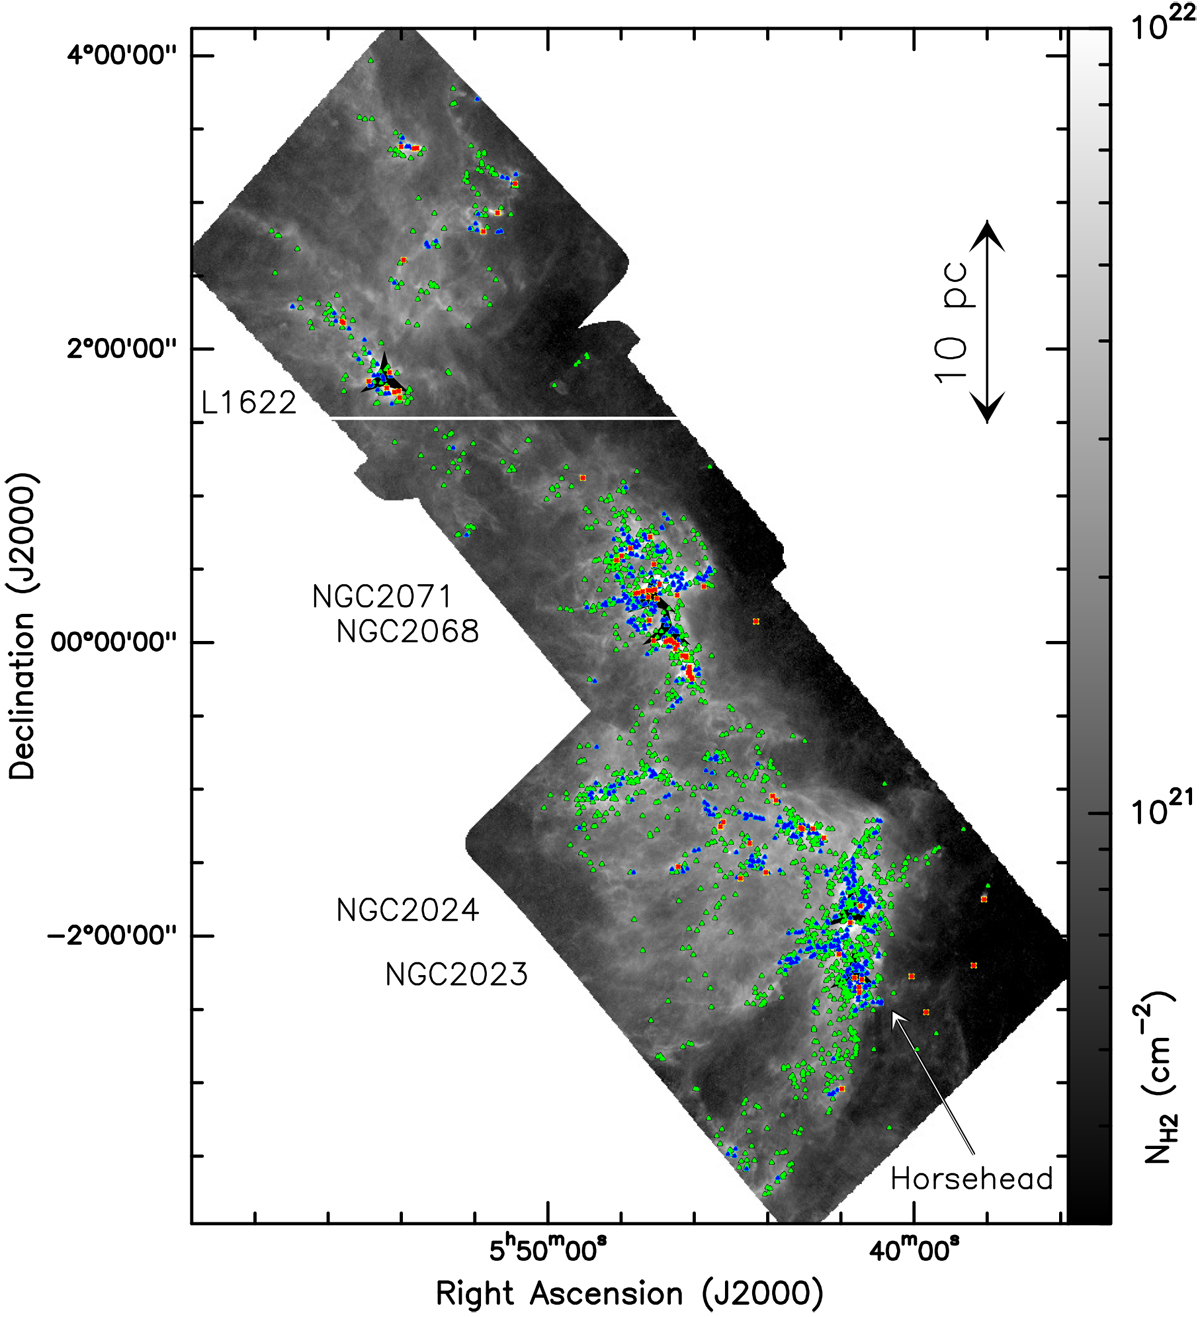
High-resolution (~18″) column density map of Orion B, derived from SPIRE and PACS observations. The positions of the 1768 identified starless cores (green triangles), 490 robust prestellar cores (blue triangles), and 76 embedded protostellar cores (red symbols) are overplotted. The vast majority of the cores lie in high column density areas. The white declination line at Dec2000 = 1° 31′ 55″ marks the lower boundary of the northern region where cores may be associated with the Barnard’s Loop and at a more uncertain distance (d ~ 170–400 pc). See Sects. 1 and 3.5.2 for details.
Current usage metrics show cumulative count of Article Views (full-text article views including HTML views, PDF and ePub downloads, according to the available data) and Abstracts Views on Vision4Press platform.
Data correspond to usage on the plateform after 2015. The current usage metrics is available 48-96 hours after online publication and is updated daily on week days.
Initial download of the metrics may take a while.