Fig. 4
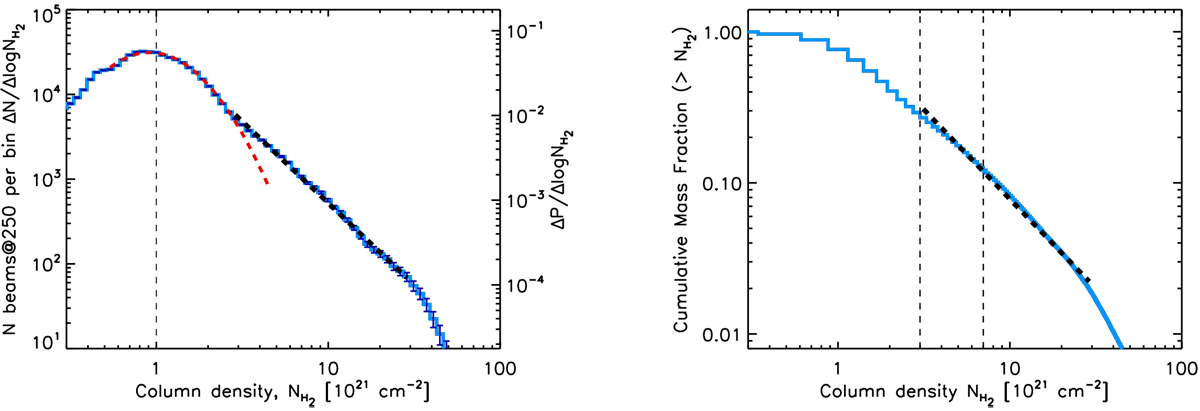
Left: high-resolution ![]() column density PDF of Orion B, derived from the column density map of
Fig. 2 left. The lognormal fit (dashed red curve) peaks at
0.92 × 1021 cm−2
in
column density PDF of Orion B, derived from the column density map of
Fig. 2 left. The lognormal fit (dashed red curve) peaks at
0.92 × 1021 cm−2
in ![]() , and has a standard deviation of ~0.25 in log
, and has a standard deviation of ~0.25 in log![]() . The power-law fit to the higher column density tail at AV ≳ 3 (dashed black line) is ΔN/Δlog
. The power-law fit to the higher column density tail at AV ≳ 3 (dashed black line) is ΔN/Δlog![]() . The vertical dashed line at AV ~ 1 marks the lowest closed contour in the column density map. Right: corresponding (normalized) cumulative mass fraction as a function of column density. The dense material above
AV ~ 3–7 mag represents only ~30–13% of the total cloud mass, respectively, as indicated by the two dashed vertical lines. A power-law fit to the cumulative mass fraction for AV ≳ 3 gives
. The vertical dashed line at AV ~ 1 marks the lowest closed contour in the column density map. Right: corresponding (normalized) cumulative mass fraction as a function of column density. The dense material above
AV ~ 3–7 mag represents only ~30–13% of the total cloud mass, respectively, as indicated by the two dashed vertical lines. A power-law fit to the cumulative mass fraction for AV ≳ 3 gives ![]() .
.
Current usage metrics show cumulative count of Article Views (full-text article views including HTML views, PDF and ePub downloads, according to the available data) and Abstracts Views on Vision4Press platform.
Data correspond to usage on the plateform after 2015. The current usage metrics is available 48-96 hours after online publication and is updated daily on week days.
Initial download of the metrics may take a while.