Fig. E.2
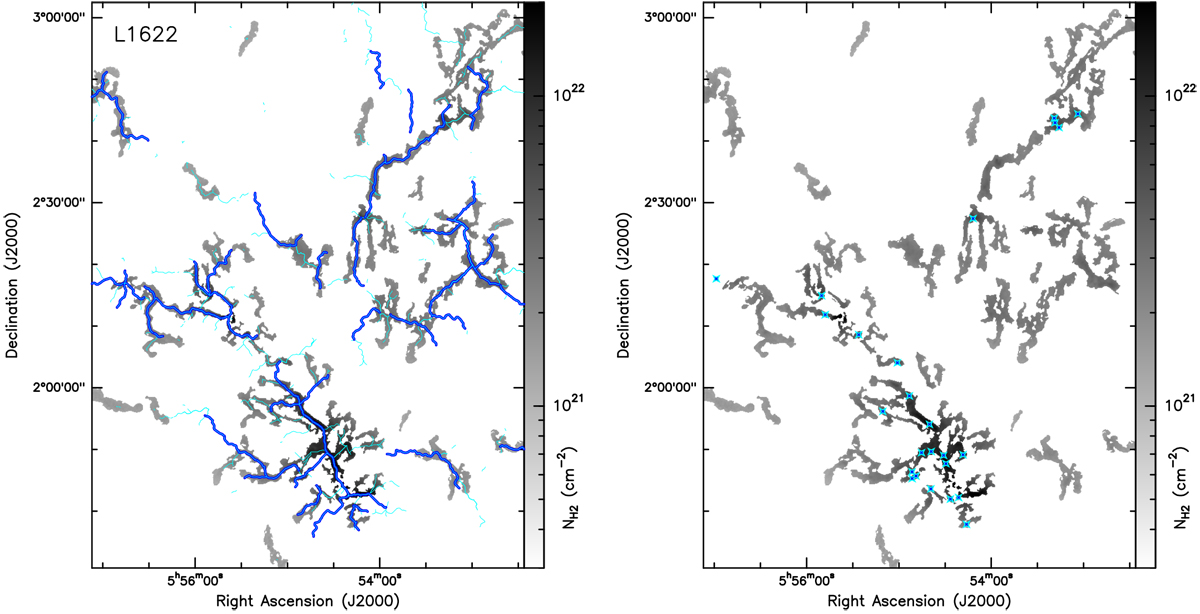
L1622 cloud and its surroundings. The gray background image shows the mask of filamentary network traced by getfilaments (Men’shchikov 2013). Within the getfilaments mask the color scale represents column density values in the column density map (Fig. 2 left). Angular scales up to 100′′ are shown, which corresponds to ~0.2 pc at d = 400 pc. Left: overplotted thicker blue skeletons mark the robust filament crests from the DisPerSE (Sousbie 2011) sample (see Sect. 3.2 for details). The latter sample together with the thin cyan crests make the DisPerSE raw sample of filaments.Right: overplotted blue crosses mark robust prestellar cores in the northern region.
Current usage metrics show cumulative count of Article Views (full-text article views including HTML views, PDF and ePub downloads, according to the available data) and Abstracts Views on Vision4Press platform.
Data correspond to usage on the plateform after 2015. The current usage metrics is available 48-96 hours after online publication and is updated daily on week days.
Initial download of the metrics may take a while.