Fig. B.2
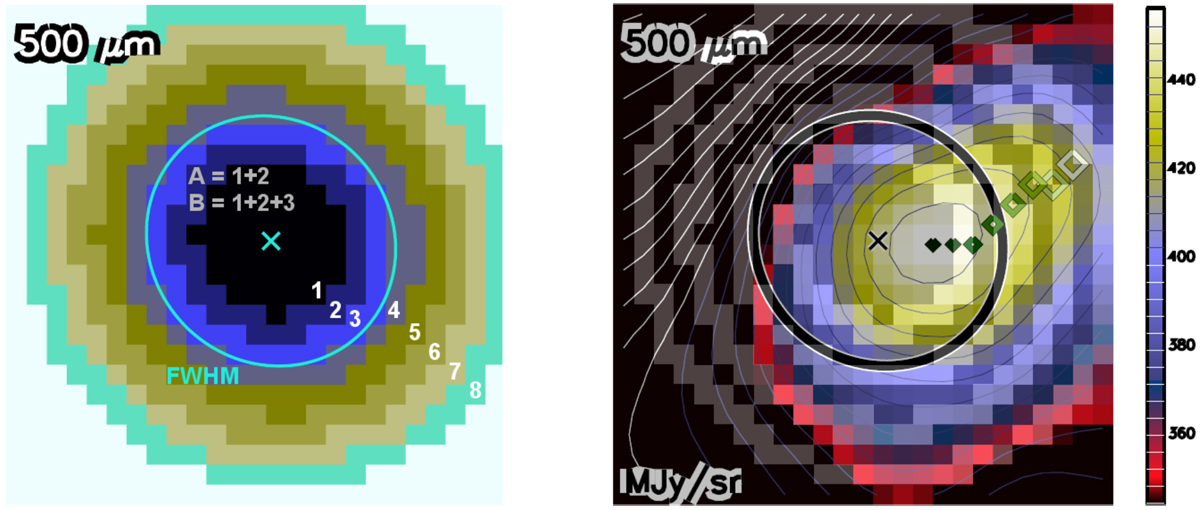
Left: examples of annular masks created inside and outside of the FWHM ellipse of each core at each wavelength. The example mask image shown here is at 500 μm and belongs to the prestellar core of Fig. B.1. Inside out, the division of the masks along the core radius is the following, considering the FWHM ellipse as 100%: region 1: <60% interior of the FWHM radius, region 2: 60–80%, 3: 80–100%, 4: 100–120%, 5: 120–140%, 6: 140–160%, 7: 160–180%, 8: 180–200%. Region A: <80% (regions 1+2), B: <100% (1+2+3). Right: the first maximum (i.e., the highest intensity pixel) in each mask is shown by a green-shaded diamond in the example image. The panel size, marked source center, and FWHM sizes are the same for each pair of mask image and observed image.
Current usage metrics show cumulative count of Article Views (full-text article views including HTML views, PDF and ePub downloads, according to the available data) and Abstracts Views on Vision4Press platform.
Data correspond to usage on the plateform after 2015. The current usage metrics is available 48-96 hours after online publication and is updated daily on week days.
Initial download of the metrics may take a while.