Fig. B.1
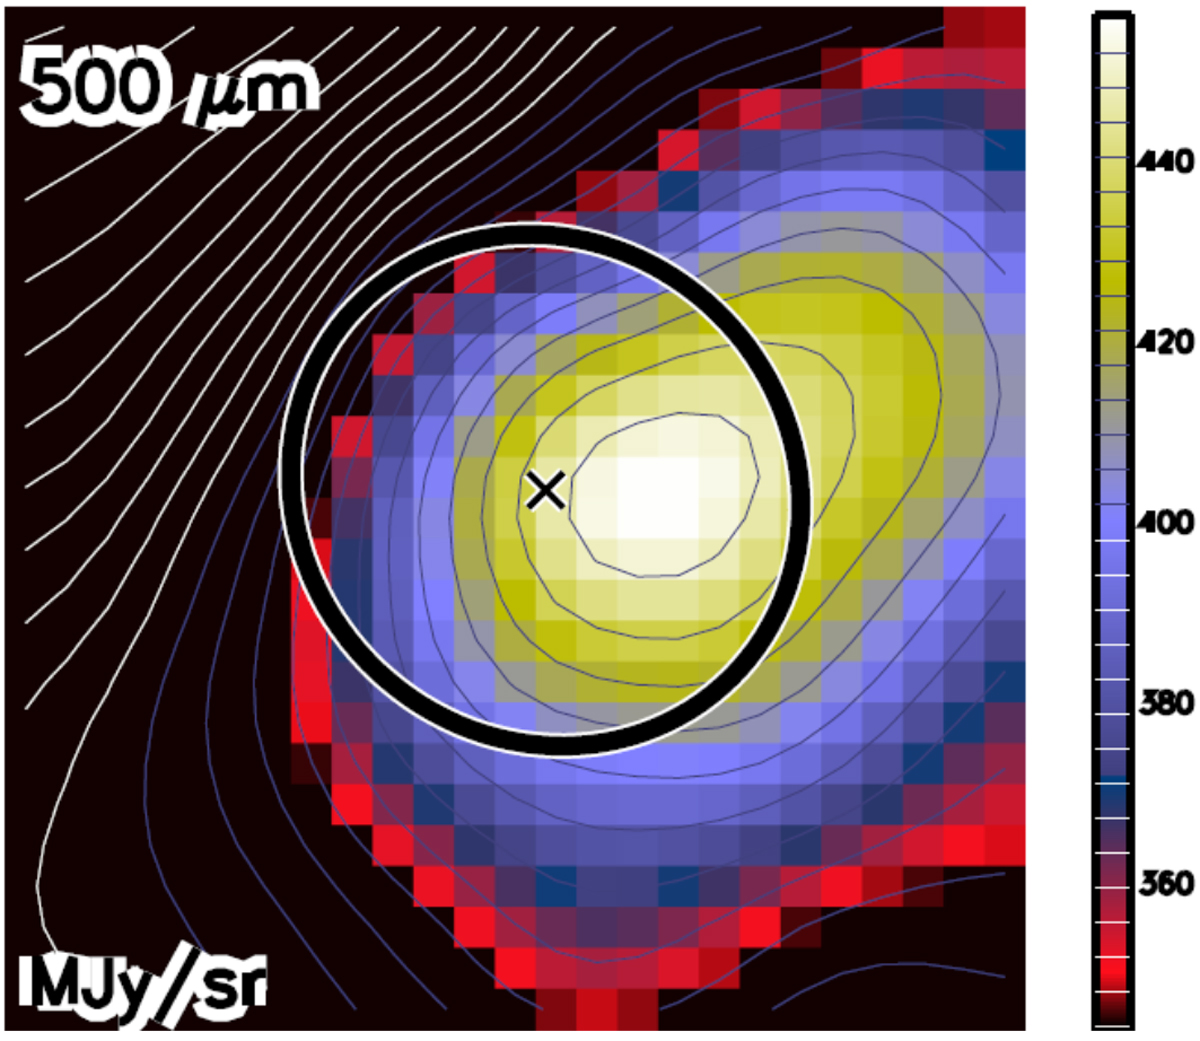
Close-up view of a post-selected prestellar core at 500 μm (shown in Fig. A.1) illustrating the post-selection procedure. At each wavelength, the map colorscale is optimizedfor the immediate neighborhood of the core; the lowest and highest map values in the considered box are blanked by black and white colors, respectively. The source center position is marked by a cross, and the FWHM ellipse automatically derived by getsources is plotted.
Current usage metrics show cumulative count of Article Views (full-text article views including HTML views, PDF and ePub downloads, according to the available data) and Abstracts Views on Vision4Press platform.
Data correspond to usage on the plateform after 2015. The current usage metrics is available 48-96 hours after online publication and is updated daily on week days.
Initial download of the metrics may take a while.