Fig. 17
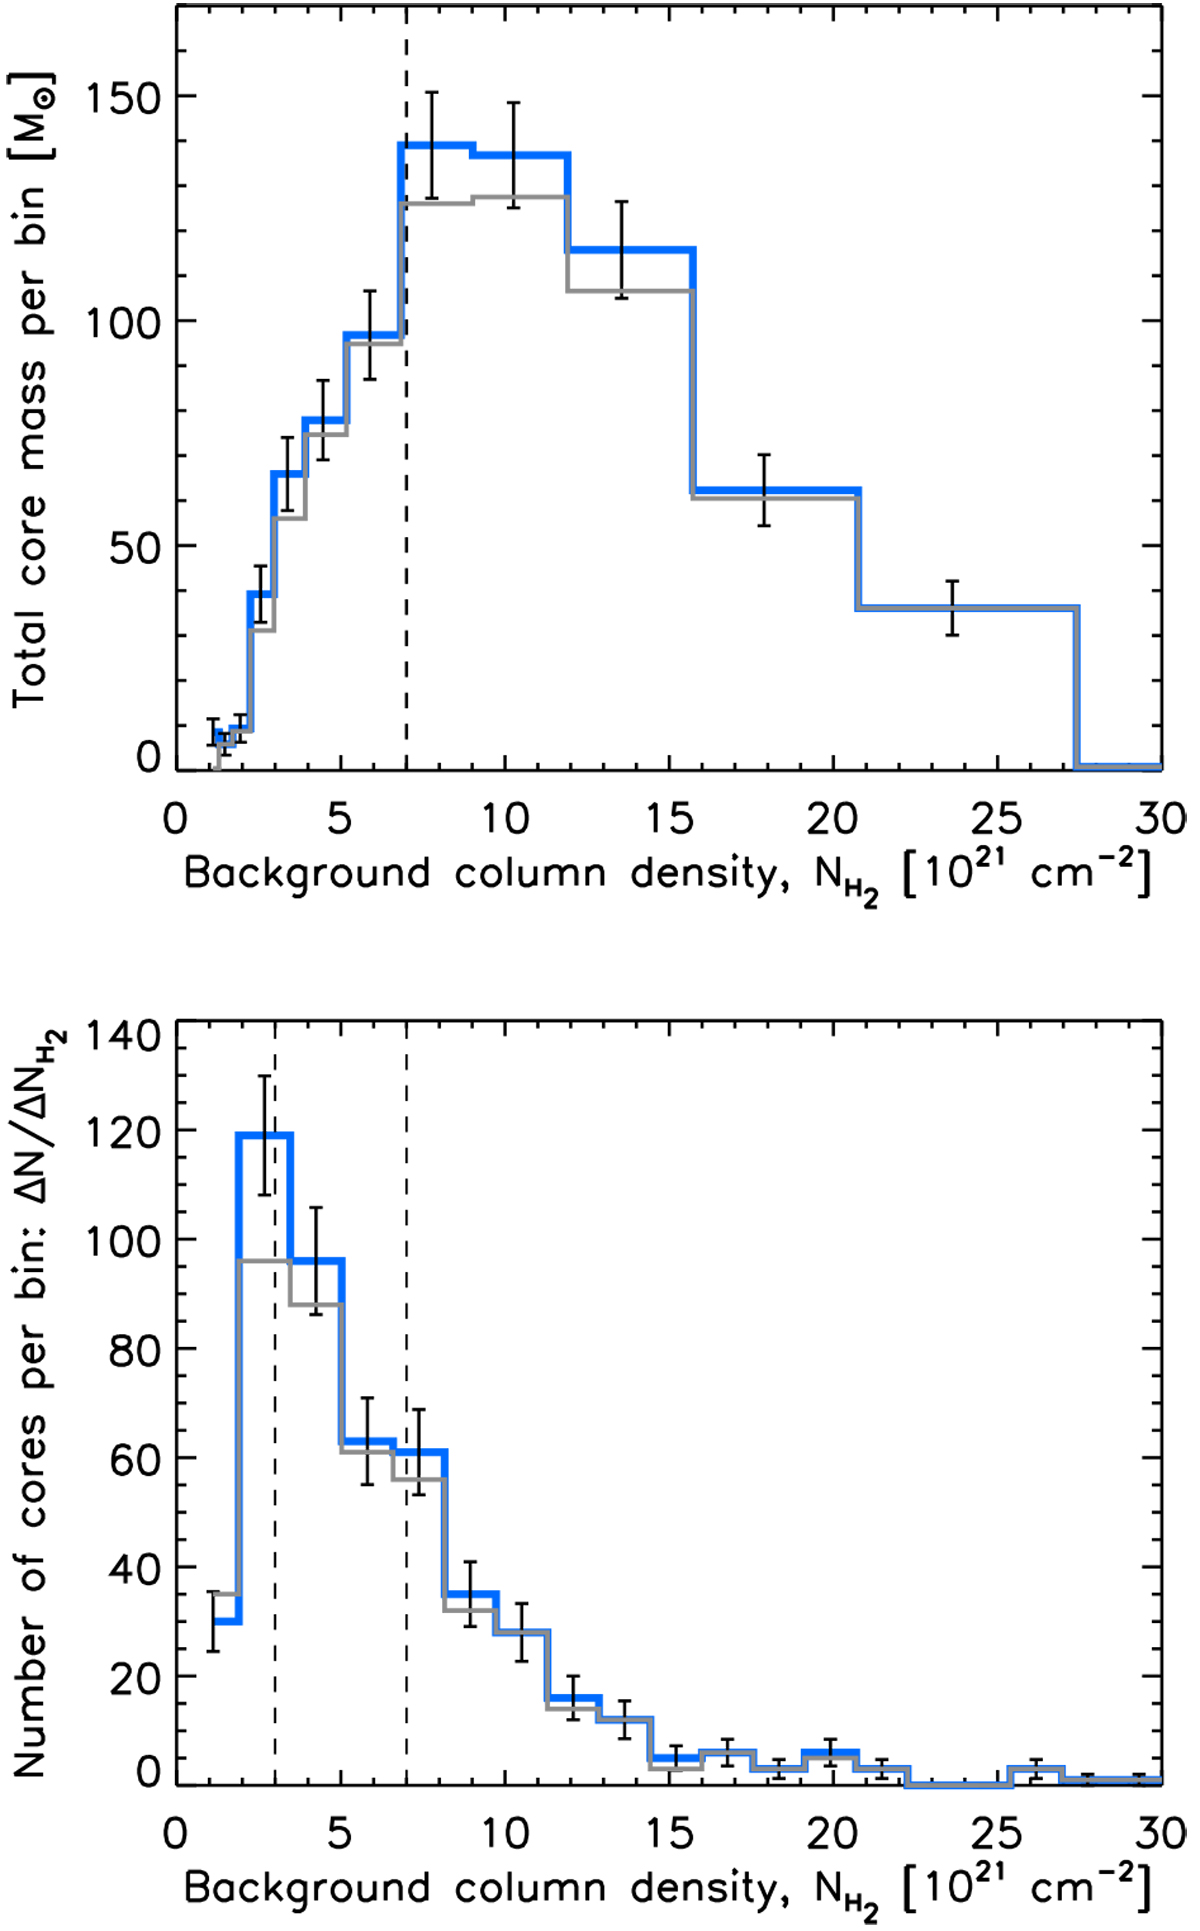
Top: total mass in form of prestellar cores as function of ambient cloud column density in Orion B (blue histogram). Bottom: distribution of background column densities for the 490 robust prestellar cores (blue histogram). The vertical dashed lines mark
![]() 3 and 7 mag. The overlaid gray histograms show the same distributions excluding the cores lying in the northern region L1622, which are at a more uncertain distance (see Sects. 1 and 3.5.2 for details).
3 and 7 mag. The overlaid gray histograms show the same distributions excluding the cores lying in the northern region L1622, which are at a more uncertain distance (see Sects. 1 and 3.5.2 for details).
Current usage metrics show cumulative count of Article Views (full-text article views including HTML views, PDF and ePub downloads, according to the available data) and Abstracts Views on Vision4Press platform.
Data correspond to usage on the plateform after 2015. The current usage metrics is available 48-96 hours after online publication and is updated daily on week days.
Initial download of the metrics may take a while.