Fig. 15
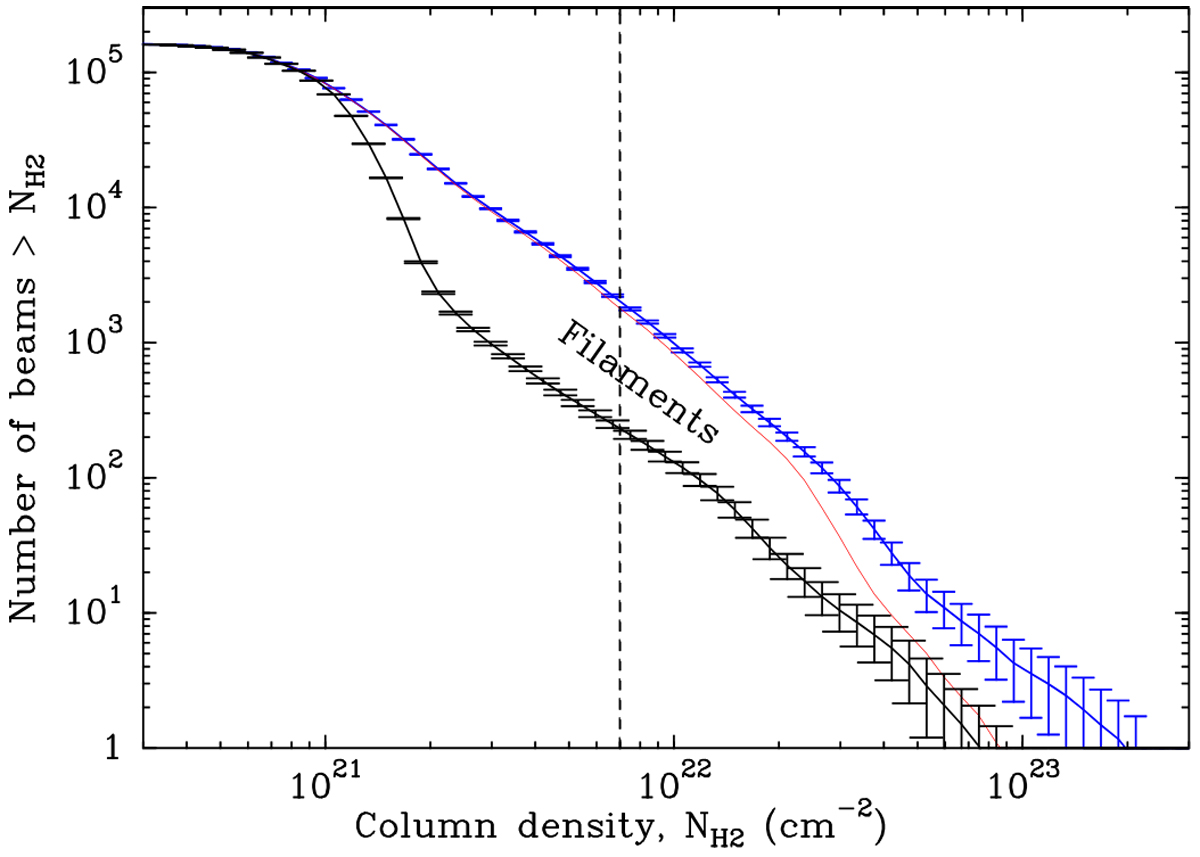
Comparison of the global column density PDF in Orion B (blue histogram) to the column density PDF measured after subtraction of dense cores (red solid line) and the PDF measured after subtraction of both dense cores and filaments (black solid line with statistical error bars). The blue histogram is identical to that shown in Fig. 4 (left). The vertical dashed line marks the approximate separation between low-to-intermediate and high column density values at
![]() 7.
7.
Current usage metrics show cumulative count of Article Views (full-text article views including HTML views, PDF and ePub downloads, according to the available data) and Abstracts Views on Vision4Press platform.
Data correspond to usage on the plateform after 2015. The current usage metrics is available 48-96 hours after online publication and is updated daily on week days.
Initial download of the metrics may take a while.