Fig. 14
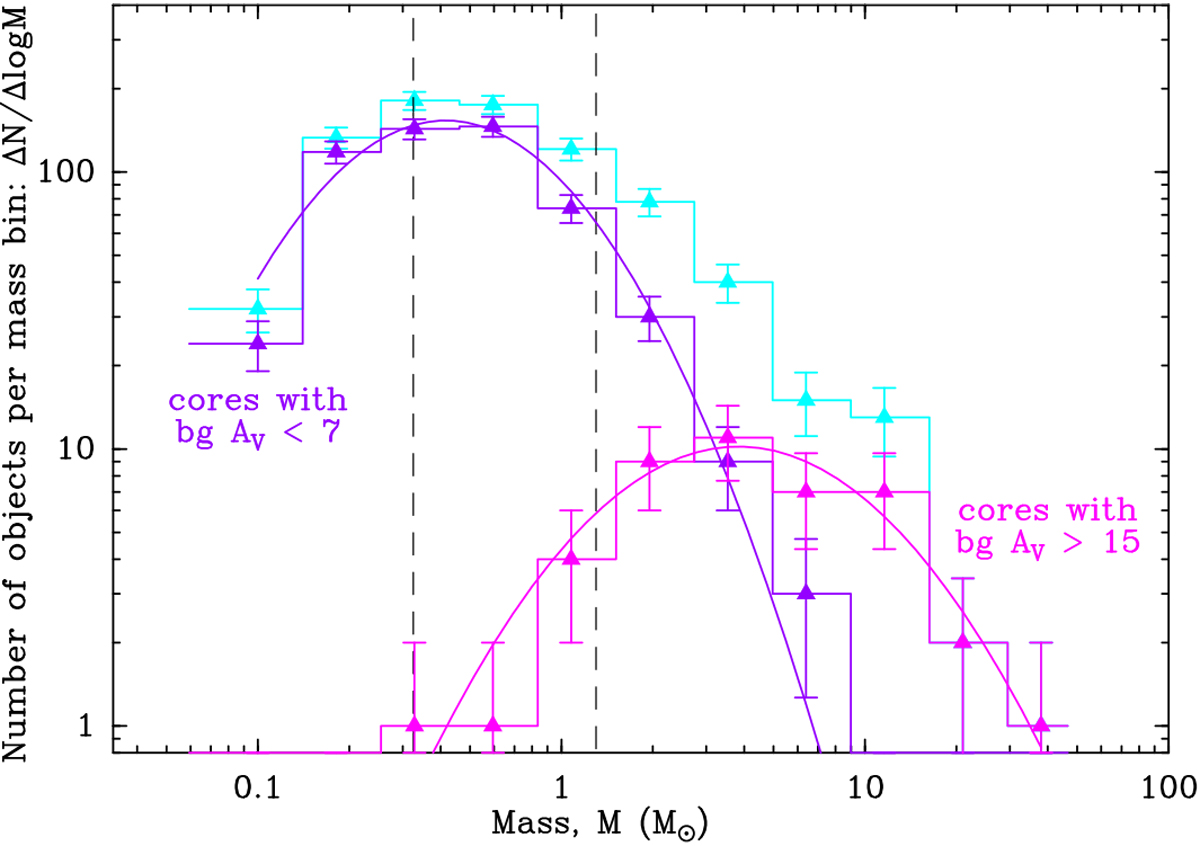
Comparison of the differential CMF (ΔN/ΔlogM) derived for the 558 candidate prestellar cores lying in areas of low background column density (![]() , purple histogram) with the CMF of the 43 candidate prestellar cores lying in areas of high column density (
, purple histogram) with the CMF of the 43 candidate prestellar cores lying in areas of high column density (![]() , magenta histogram). Lognormal fits are shown in both cases, and have peaks at 0.4 M⊙ and 3.8 M⊙, respectively. Vertical dashed lines show the 80% completeness limits of the low and high column density samples at 0.33 M⊙
and 1.3 M⊙, respectively. The overplotted histogram in light blue is the CMF of all 804 candidate prestellar cores (same as in
Fig. 13).
, magenta histogram). Lognormal fits are shown in both cases, and have peaks at 0.4 M⊙ and 3.8 M⊙, respectively. Vertical dashed lines show the 80% completeness limits of the low and high column density samples at 0.33 M⊙
and 1.3 M⊙, respectively. The overplotted histogram in light blue is the CMF of all 804 candidate prestellar cores (same as in
Fig. 13).
Current usage metrics show cumulative count of Article Views (full-text article views including HTML views, PDF and ePub downloads, according to the available data) and Abstracts Views on Vision4Press platform.
Data correspond to usage on the plateform after 2015. The current usage metrics is available 48-96 hours after online publication and is updated daily on week days.
Initial download of the metrics may take a while.