Fig. 13
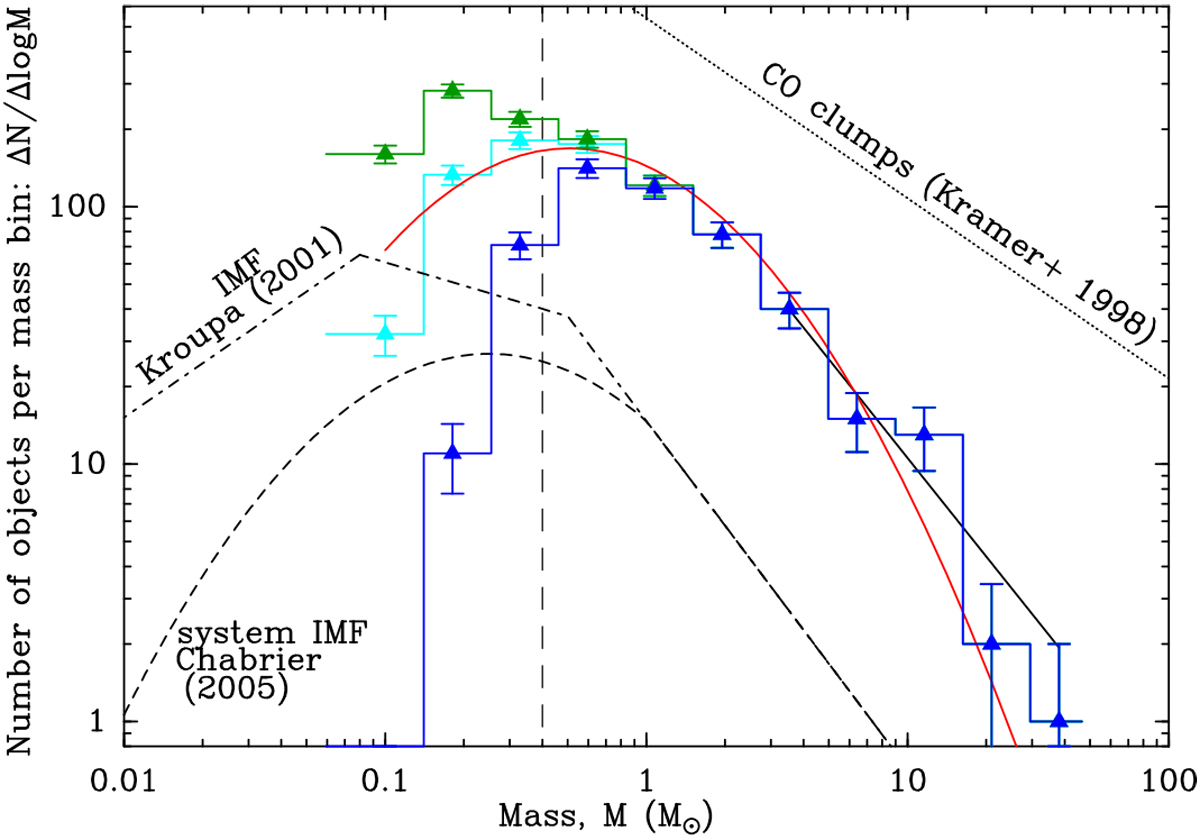
Differential core mass function (ΔN/ΔlogM) of the 1768starless cores (green histogram), 804 candidate prestellar cores (light blue histogram), and 490 robust
prestellar cores (dark blue histogram) identified with Herschel in the whole Orion B field. The error bars correspond to
![]() statistical uncertainties, and the vertical dashed line shows the completeness limit of the prestellar sample at
~ 0.4 M⊙. A lognormal fit to the CMF of candidate prestellar cores (solid red curve), as well as a power-law fit to thehigh-mass end of the CMF (black solid line) are superimposed. The lognormal fit peaks at 0.5 M⊙, and has a standard deviation of ~0.52 in log10 M. The power-law fit has a slope of –1.27 ± 0.24 (compared to a Salpeter slope of − 1.35 in this format). The IMF of single stars (corrected for binaries – e.g., Kroupa 2001), the IMF of multiple systems (e.g., Chabrier 2005), and the typical mass distribution of CO clumps (e.g., Kramer et al. 1998) are also shown for comparison.
statistical uncertainties, and the vertical dashed line shows the completeness limit of the prestellar sample at
~ 0.4 M⊙. A lognormal fit to the CMF of candidate prestellar cores (solid red curve), as well as a power-law fit to thehigh-mass end of the CMF (black solid line) are superimposed. The lognormal fit peaks at 0.5 M⊙, and has a standard deviation of ~0.52 in log10 M. The power-law fit has a slope of –1.27 ± 0.24 (compared to a Salpeter slope of − 1.35 in this format). The IMF of single stars (corrected for binaries – e.g., Kroupa 2001), the IMF of multiple systems (e.g., Chabrier 2005), and the typical mass distribution of CO clumps (e.g., Kramer et al. 1998) are also shown for comparison.
Current usage metrics show cumulative count of Article Views (full-text article views including HTML views, PDF and ePub downloads, according to the available data) and Abstracts Views on Vision4Press platform.
Data correspond to usage on the plateform after 2015. The current usage metrics is available 48-96 hours after online publication and is updated daily on week days.
Initial download of the metrics may take a while.